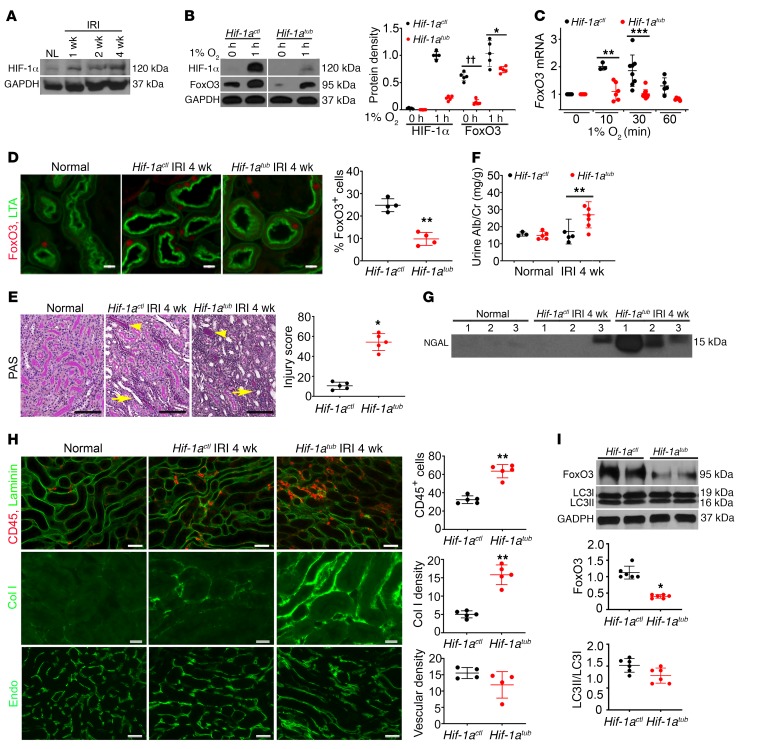
Figure 3. HIF-1α contributes to FoxO3 activation and CKD protection.
(A) HIF-1α protein levels increased during CKD development. n = 4. (B–C) HIF-1α was deleted using the Pax8-rtTA and Tet-O-Cre system by giving mice doxycycline for 2 weeks prior to primary culture (Hif-1atub). Vehicle-treated mice (Hif-1actl) were used as controls. (B) The hypoxia-induced increase in FoxO3 protein was partially dependent on HIF-1α in primary cultures. n = 5 with duplicates. ††P < 0.01 and *P ˂ 0.05 comparing Hif-1atub with Hif-1actl at 0 hours and 1 hour, respectively. (C) HIF-1α deletion abolished the increase in FoxO3 mRNA in response to hypoxia with 1% O2. n = 3–8 with duplicates. **P < 0.01 and ***P < 0.001 compared with cells prior to exposure to 1% O2 (0 min) in the Hif-1actl or Hif-1atub group. (D) Nuclear expression of FoxO3 (red) was higher in proximal tubules (labeled with LTA in green) of Hif-1actl kidneys 4 weeks after IRI. n = 4. **P < 0.01. (E–I) Tubular HIF-1α was deleted from day 8 to day 21 following a 35-minute left IRI and right nephrectomy, and kidneys were analyzed 4 weeks after IRI. Tubular deletion of HIF-1α led to more severe tubular atrophy (arrowheads) and cast formation (arrows) (E, PAS staining, n = 5), higher urinary albumin and creatinine (Alb/Cr) levels (F, n = 3 or 5 for normal controls; n = 5 or 6 for 4 weeks after IRI), higher urinary NGAL excretion (G, n = 3 or 5 for normal controls; n = 5 or 6 for 4 weeks after IRI), and more interstitial inflammation and fibrosis (H). For the images in H, the top panel shows more infiltrating CD45-expressing leukocytes (red, n = 5), the middle panel shows more fibrosis with collagen I (Col I) deposition (green, n = 5), and the bottom panel shows no significant differences in the density of capillaries labeled with endomucin (green, n = 4) compared with Hif-1actl kidneys. (I) Blots show lower levels of FoxO3 protein in Hif-1atub kidneys compared with levels in Hif-1actl kidneys, but no significant difference in the LC3II/LC3I ratio was detected. n = 6. *P ˂ 0.05 and **P ˂ 0.01, comparing Hif-1atub with Hif-1actl (E, F, H, and I). Scale bars: 100 μm (E), 50 μm (top and bottom panels of H), and 20 μm (D and middle panel of H). Statistical significance was determined by 2-tailed Student’s t test (B, D, F, H, and I), Wilcoxon-Mann-Whitney U test (E), and 1-way ANOVA followed by Dunnett’s post hoc test for multiple comparisons (C).

