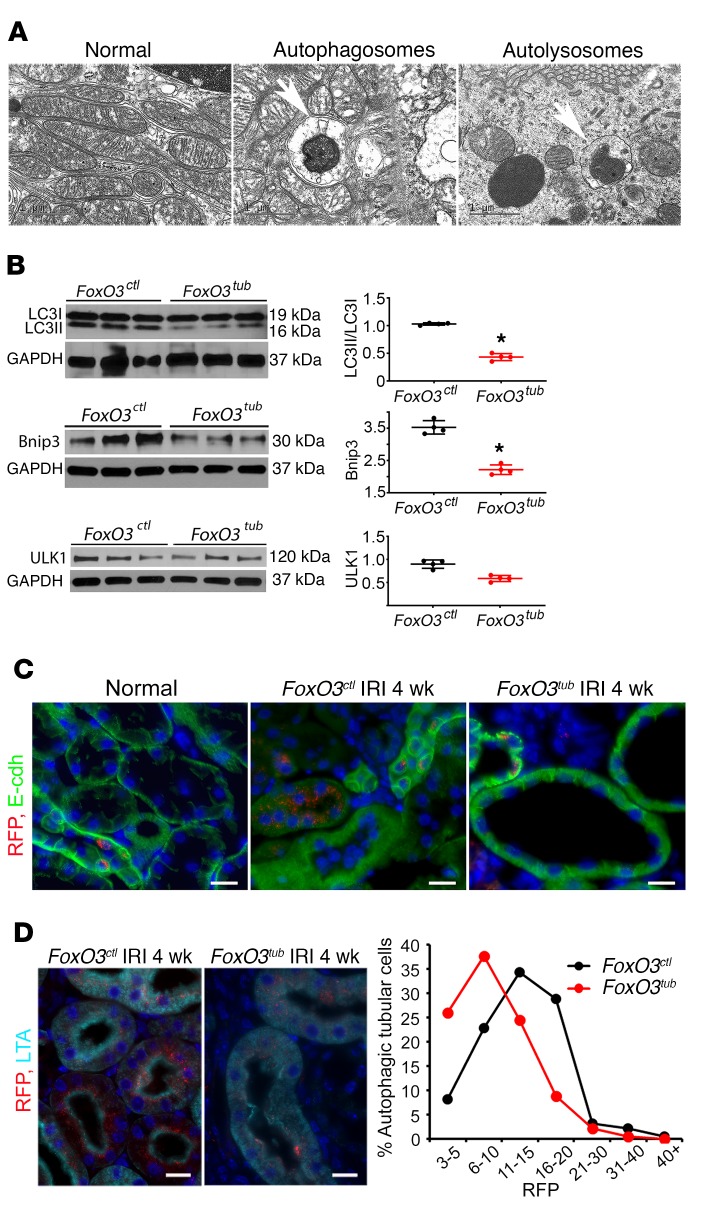
Figure 6. Loss of FoxO3 results in reduced autophagic adaptation.
Tubular FoxO3 was deleted from day 8 to day 21 following a 35-minute left kidney IRI and right nephrectomy. Kidneys were analyzed 4 weeks after IRI. (A) Representative EM images of autophagosomes and autolysosomes (white arrows) in tubules of FoxO3ctl mice 4 weeks after IRI. (B) Lower levels of LC3II, LC3I, and Bnip3 proteins were detected, but no significant changes in ULK1 protein levels were seen in FoxO3tub kidneys (n = 4). *P ˂ 0.05 comparing FoxO3tub with FoxO3ctl, by 2-tailed Student’s t test. (C) The autophagy reporter CREL mice were bred with FoxO3tub and FoxO3ctl mice and subjected to IRI, as above. Fewer RFP dots were visible in renal tubules labeled with E-cadherin (green) that appeared atrophic in FoxO3tub mice. Tubules in FoxO3ctl mice contained a greater abundance of RFP dots. (D) Quantification of RFP dots in proximal tubules (labeled in cyan with LTA) indicated that the majority of autophagic cells in FoxO3tub kidneys contained 10 or fewer dots per cell, whereas the majority of autophagic cells in FoxO3ctl kidneys contained 10 or more dots per cell. Nuclei were counterstained with DAPI in blue in C and D. Scale bars: 20 μm (C and D).

