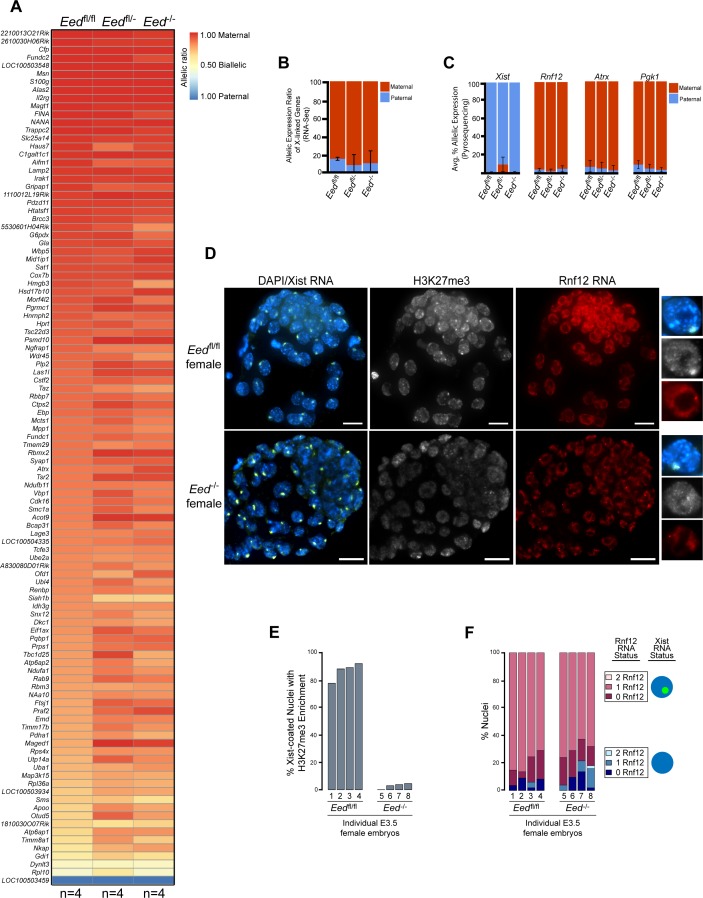
Figure 3. Lack of defective X-inactivation initiation in Eed-/- blastocysts.
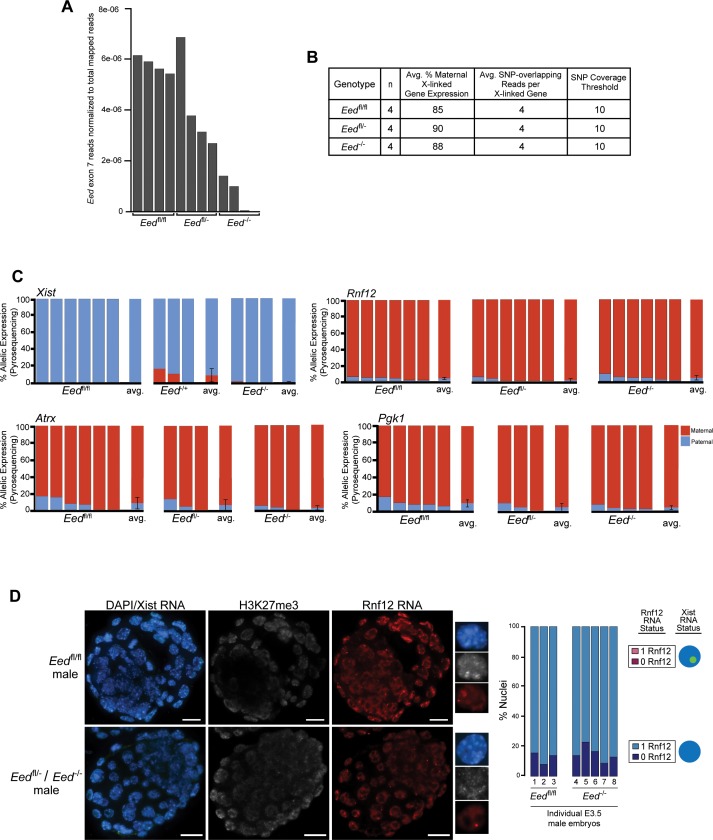
See also Figure 3—figure supplement 1. (A) Allele-specific X-linked gene expression heat map of female Eedfl/fl, Eedfl/-, and Eed-/- blastocysts. Four embryos each of Eedfl/fl, Eedfl/-, and Eed-/- genotypes were sequenced individually and only genes with informative allelic expression in all samples are plotted (see Materials and methods). Genes are ordered on the basis of allelic expression in Eedfl/fl embryos. (B) Average allelic expression of the RNA-Seq data shown in (A). The mean allelic expression of X-linked genes lacks significant difference between each combination of the three genotypes (p>0.05, Welch’s two-sample T-test). Pairwise statistical comparisons between all genotypes are included in Supplementary file 3. (C) Pyrosequencing-based quantification of allelic expression of X-linked genes Xist, Rnf12, Atrx and Pgk1 in Eedfl/fl, Eedfl/-, and Eed-/- blastocysts. Error bars represent the standard deviation of data from 3 to 6 independent blastocyst embryos. The mean allelic expression of all four genes lack significant difference between each combination of the three genotypes (p>0.05, Welch’s two-sample T-test). Pairwise statistical comparisons for all genes and between all genotypes are included in Supplementary file 4. (D) RNA FISH detection of Xist RNA (green), Rnf12 RNA (red), and IF detection of H3K27me3 (white) in representative Eedfl/fl or Eed-/- female blastocysts. Nuclei are stained blue with DAPI. Scale bars, 20 µm. Individual nuclei displaying representative categories of stains are shown to the right of each embryo. Embryos ranged in size from 39 to 100 nuclei. (E) Bar plot of percentage of nuclei with coincident accumulation of Xist RNA and H3K27me3 in individual Eedfl/fl and Eed-/- embryos. Each bar is an individual embryo. Embryo numbers under the bars correspond to the same embryos plotted in F). (F) Bar plots of percentage of nuclei with or without Xist RNA-coating and Rnf12 RNA expression in the embryos stained in D) and plotted in E). The numbers under the bars correspond to the same embryos plotted in E).


