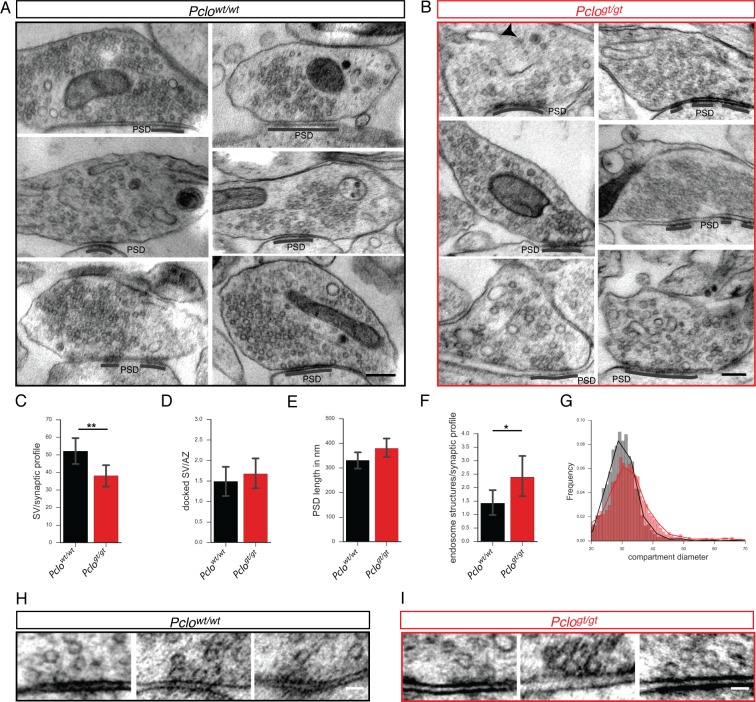
Figure 2. Pclogt/gt synapses display morphological changes at the ultrastructural level.
(A and B) Example electron micrographs of Pclowt/wt (A) and Pclogt/gt (B) synapses. (C–G) Quantification of electron micrographs. (C) Synaptic vesicle density is decreased in Pclogt/gt terminals (Pclowt/wt = 51.73 ± 4.05, n = 52 synapses; Pclogt/gt = 38.08 ± 3.19, n = 59 synapses). (D) The number of docked vesicles per active zone is not altered (Pclowt/wt = 1.49 ± 0.18, n = 59 AZs; Pclogt/gt = 1.67 ± 0.18, n = 40 AZs). (E) The total length of the PSDs is not altered (Pclowt/wt = 331 ± 17.09 nm, n = 72 PSDs; Pclogt/gt = 379.6 ± 18.22 nm, n = 69 PSDs). (F) The number of endosome structures is increased at Pclogt/gt synapses (Pclowt/wt = 1.42 ± 0.24, n = 52 synapses; Pclogt/gt = 2.39 ± 0.38, n = 57 synapses). (G) Histogram depicting the distribution of endosome compartment diameters. Pclogt/gt vesicular compartments show a shift towards larger diameters (Pclowt/wt: n = 2729 compartments measured; Pclogt/gt: n = 2387 compartments measured). (H and I) Example electron micrographs showing docked vesicles at Pclowt/wt (H) and Pclogt/gt AZs (I). Scale bar in A and B 200 nm, scale bar in D and E 50 nm. Error bars in bar graph represent 95% confidence intervals. Numbers given represent mean ± SEM, Students t-test. * denotes p<0.05, ** denotes p<0.01.

