. 2019 May 10;8:e46629. doi: 10.7554/eLife.46629

Figure 5. Fewer endosome proteins are recruited towards PI3P-positive organelles along axons lacking Piccolo.

(A) Schematic of early endocytic trafficking steps. After pinching off from the plasma membrane early endocytic vesicles undergo consecutive maturation steps. The lipid PI3P is generated and a stable complex consisting of Rab5 and its GEF Rabex5 is formed creating a pool of active Rab5. This step is necessary to recruit EEA1 and form early endosomes. (B) Images depicting Rab5 and EEA1 intensities at GFP-2x-FYVE organelles along axons in Pclogt/gt vs Pclowt/wt neurons. (C–F) Quantification of B. (C) The levels of Rab5 at PI3P-positive organelles are decreased (Pclowt/wt = 1 ± 0.02, n = 1645 puncta; Pclogt/gt = 0.81 ± 0.02, n = 1233 puncta; six independent experiments). (D) The amount of EEA1 at endosome membranes is reduced (Pclowt/wt = 1 ± 0.04, n = 1634 puncta; Pclogt/gt = 0.37 ± 0.02, n = 1169 puncta; six independent experiments). (E) Quantification of double positive compartments along axons. The fraction of GFP-2x-FYVE/Rab5 is not altered (Pclogt/gt = 0.97 ± 0.33, n = 5 independent experiments). (F) The relative percentage of GFP-2x-FYVE/Rab5/EEA1 positive vesicles is decreased in Pclogt/gt neurons (GFP-2x-FYVE/Rab5/EEA1: Pclogt/gt = 0.28 ± 0.10, n = 6 independent experiments). Scale bars represent 10 μm. Error bars in bar graph represent 95% confidence intervals. Numbers given represent mean ± SEM, Student`s t -test. * denotes p<0.05, ** denotes p<0.01, *** denotes p<0.001 and **** denotes p<0.0001.

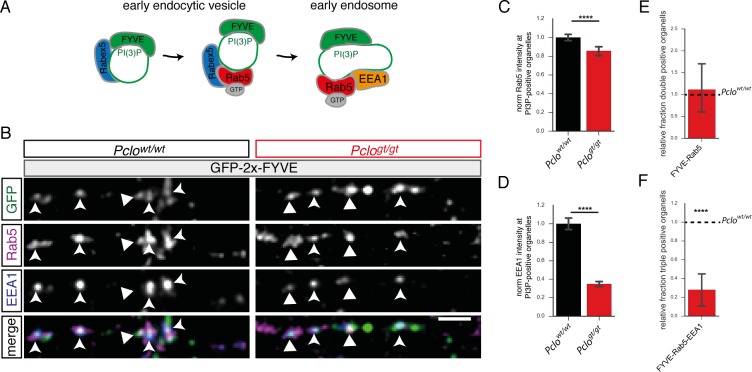
Figure 5—source data 1. This spreadsheet contains the normalized values used to generate the bar plots shown in Figure 5C,D,E and F.
elife-46629-fig5-data1.xlsx (119.6KB, xlsx)
DOI: 10.7554/eLife.46629.016

Figure 5.

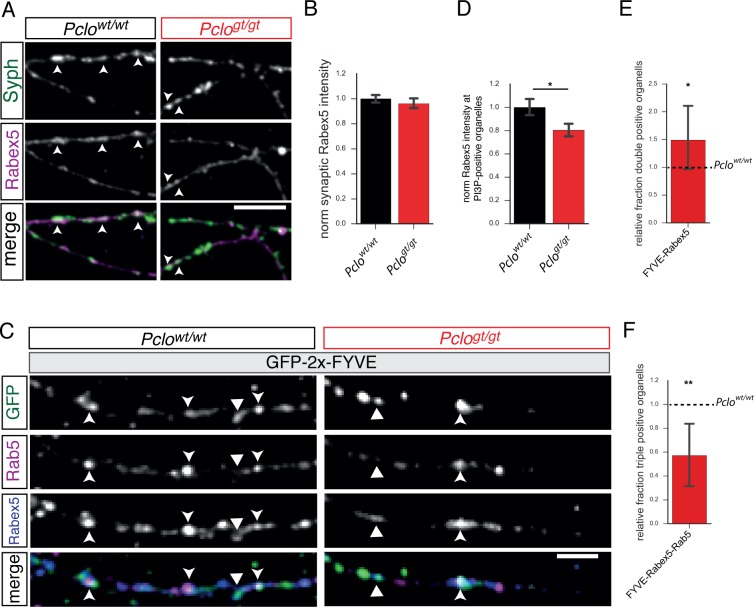
Figure 5—figure supplement 1. Synaptic Rabex5 levels as well as Rabex5 amounts at PI3P-positive organelles are reduced in neurons lacking Piccolo.

Figure 5—figure supplement 1.

(A) Immunocytochemical staining of hippocampal neurons for Rabex5. (B) Quantification of (A). Rabex5 is present at Pclowt/wt and Pclogt/gt synapses, no difference in the intensities is detectable (Pclowt/wt = 1 ± 0.02, n = 2397 synapses; Pclogt/gt = 0.96 ± 0.02, n = 1802 synapses; seven independent experiments). (C) Images depicting Rabex5 intensities at PI3P-positive organelles. (D) Quantification of (C). Less Rabex5 is present at PI3P-positive membranes in Pclogt/gt neurons (Pclowt/wt = 1 ± 0.04, n = 728 puncta; Pclogt/gt = 0.80 ± 0.03, n = 652 puncta; six independent experiments). (E) Quantification of double positive compartments along axons. The fraction of GFP-2x-FYVE/Rabex5 double positive vesicles is increased in Pclogt/gt neurons (Pclogt/gt = 1.49 ± 0.33, n = 5 independent experiments). (F) The relative percentage of GFP-2x-FYVE-Rabex5-Rab5 triple positive compartments is decreased in Pclogt/gt neurons (Pclogt/gt = 0.57 ± 0.14, n = 5 independent experiments). Scale bar represents 10 μm. Error bars in bar graph represent 95% confidence intervals. Numbers given represent mean ± SEM, Student`s t-test.