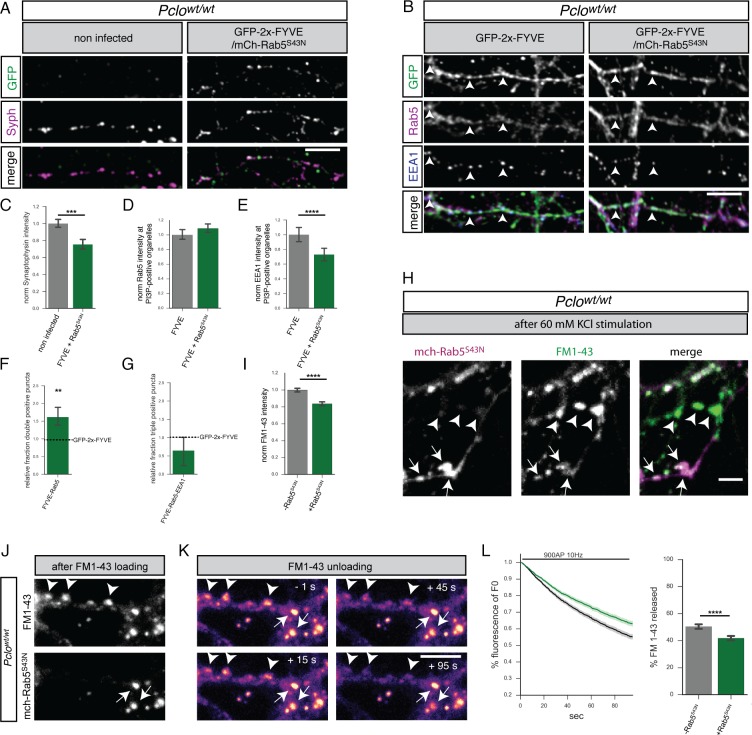
Figure 6. GDP-locked Rab5 (Rab5S34N) expression in Pclowt/wt neurons decreases Synaptophysin levels and the number of early endosomes.
(A) Images of Pclowt/wt neurons expressing GFP-2x-FYVE and mCh-Rab5S34N immuno-stained with Synaptophysin antibodies. (B) Images of Pclowt/wt neurons expressing GFP-2x-FYVE and mCh-Rab5S34N immuno-stained with GFP, Rab5 and EEA1 antibodies. (C) Quantification of (A). Synaptophysin levels are reduced in neurons expressing Rab5S34N (Pclowt/wt = 1 ± 0.02, n = 204 synapses; Pclowt/wt + mCh-Rab5S34N = 0.75 ± 0.03, n = 139 synapses; two independent experiments). (D–G) Quantification of B. (D) mCh-Rab5S34N expression slightly increases Rab5 levels at PI3P-positive organelles (Pclowt/wt = 1 ± 0.03, n = 930 puncta; Pclowt/wt + mCh-Rab5S34N = 1.09 ± 0.03, n = 612 puncta; three independent experiments). (E) EEA1 levels at PI3P-positive organelles decrease upon mCh-Rab5S34N expression (Pclowt/wt = 1 ± 0.05, n = 930 puncta; Pclowt/wt + mCh-Rab5S34N = 0.73 ± 0.04, n = 613; three independent experiments). (F) More FYVE/Rab5 positive organelles are present in mCh-Rab5S34N expressing neurons (Pclowt/wt = 1 ± 0; Pclowt/wt + mCh-Rab5S34N = 1.614 ± 0.15; n = 4 independent experiments). (G) Fewer FYVE/Rab5/EEA1 triple positive organelles are present in mCh-Rab5S34N expressing neurons (Pclowt/wt = 1 ± 0; Pclowt/wt + mCh-Rab5S34N = 0.64 ± 0.22; n = 4 independent experiments). (H) Representative images depicting FM1-43 uptake efficiency after KCl stimulation in boutons either expressing Rab5S34N (arrow) or not (arrowhead). (I) Quantification of (H). Less FM1-43 dye is taken up during KCl stimulation in the presence of mCh-Rab5S34N (Pclowt/wt = 1 ± 0.01, n = 732 puncta; Pclowt/wt + mCh-Rab5S34N = 0.84 ± 0.01, n = 866 puncta; three independent experiments). (J) Images showing FM1-43 levels in Pclowt/wt neurons expressing mCh-Rab5S34N after 900AP 10 Hz field stimulation. (K) Representative images showing FM1-43 unloading kinetics in synapses shown in (J) (note boutons expressing or not expressing mCh-Rab5S34N are labeled with arrows or arrowheads, respectively). (L) Quantification of (K). Neurons expressing mCh-Rab5S34N (green trace) release less FM1-43 dye with slower kinetics compared to Pclowt/wt neurons (black trace) (Pclowt/wt = 50.43 ± 0.8471, n = 293 synapses; Pclowt/wt + mCh-Rab5S34N = 41.79 ± 0.8052, n = 421 synapses, three independen experiments). Scale bars in A and B represent 10 μm, in H and K 5 μm, Error bars in bar graph represent 95% confidence intervals. Numbers given represent mean ± SEM Students`s t - test. * denotes p<0.05, ** denotes p<0.01, *** denotes p<0.001, **** denotes p<0.0001.

