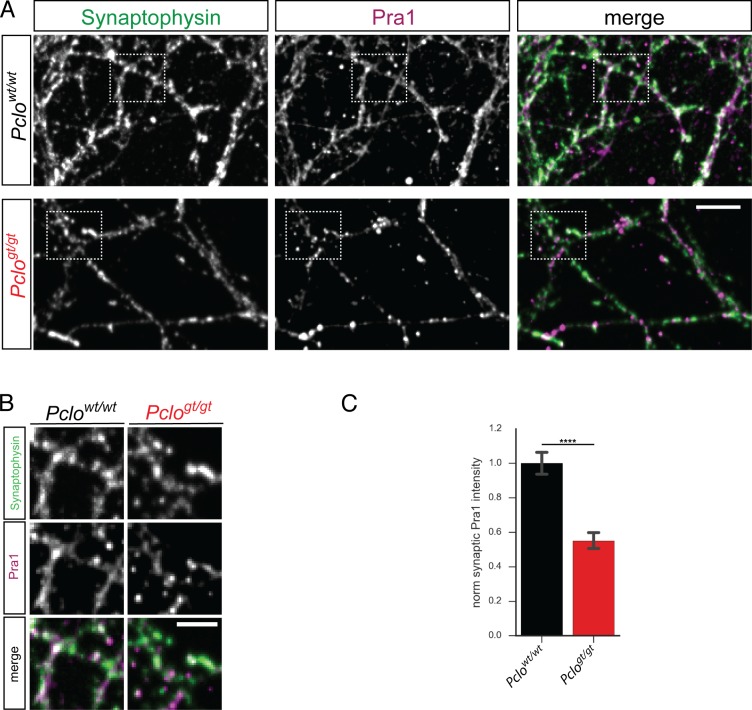
Figure 9. The loss of Piccolo leads to diminished levels of synaptic Pra1.
(A) Images of Pclowt/wt and Pclogt/gt neurons stained with Synaptophysin and Pra1 antibodies. Pra1 is present at Synaptophysin positive synapses in Pclowt/wt synapses but is reduced in Pclogt/gt synapses. (B) Detail images of areas indicated in (A). (C) Quantitation of (A). Loss of Piccolo decreases Pra1 intensity at synapses compared to Pclowt/wt synapses (Pclowt/wt = 1 ± 0.03, n = 474 synapses; Pclogt/gt = 0.55 ± 0.02, n = 723; three independent experiments). Scale bar represents 10 μm and 5 μm in zoom image, Error bars in bar graph represent 95% confidence intervals. Numbers given represent mean ± SEM, Student`s t –test. **** denotes p<0.0001.


