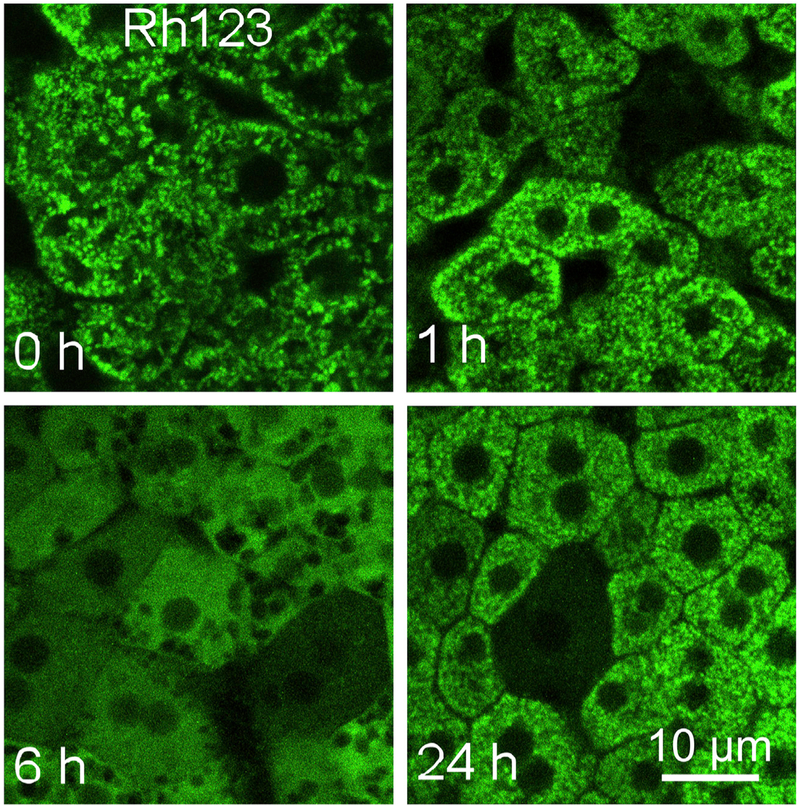
Fig. 3. Hepatic mitochondrial depolarization during adaptive ethanol metabolism.
Mice were gavaged with 6 g/kg ethanol, and mitochondrial depolarization was visualized by intravital multiphoton microscopy of rhodamine 123 (Rh123, all panels) at 0–24 h after treatment. Adapted from reference 27.

