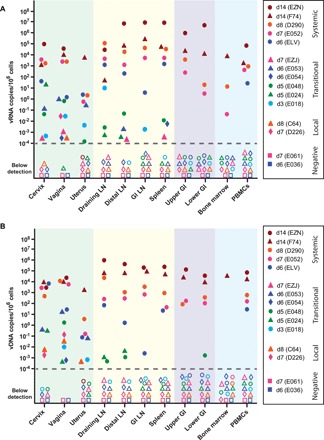
Fig. 2. Viral nucleic acid distribution during primary infection.

Viral RNA (vRNA) (A) and viral DNA (vDNA) (B) quantities were assessed by qRT-PCR or qPCR from nucleic acids obtained from ~1-cm3 pieces of tissue. Individual tissue viral loads were averaged and plotted for each tissue indicated. Background shading indicates different types of tissues [green, FGT; yellow, lymphatic system; purple, gastrointestinal (GI) tract; blue, bone marrow and peripheral blood mononuclear cells (PBMCs)]. Individual symbols are color-coded based on days after infection until necropsy (red, d14; orange, d8; pink, d7; blue, d6; green, d5; cyan, d3) with animals grouped based on phases of infection (negative, local, transitional, and systemic). Missing symbols indicate no data available. Open symbols indicate no detectable vRNA or vDNA. For simplicity, the limit of detection for each tissue type is not identified in this figure (see fig. S4 for limit of detection per sample).
