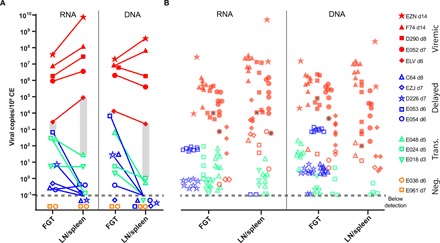
Fig. 5. A tissue infection threshold for viral dissemination to plasma.

(A) The sum of vRNA and vDNA for all pieces of the FGT and for LNs/spleen is plotted for animals with different levels of viral dissemination. Viremic animals are indicated in red, delayed animals are in blue, transitional animals are in green, and negative animals are in orange. Open symbols indicate undetected in plasma. Gray shading indicates the approximate threshold level of tissue infection observed in animals that had detectable plasma virus. (B) The proportion of the total viral load for each individual lineage was plotted with the same symbol as the total but shaded. Where individual lineages were not found in plasma, this is displayed as an open symbol. Gray-filled symbols represent variant D. Similar threshold levels of infection appear to apply for individual lineages, since only a minority of lineages with concentrations below the threshold are observed in plasma. The limit of detection is indicated by a dashed line.
