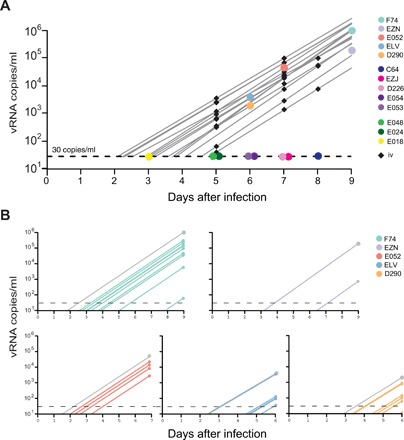
Fig. 6. Using estimated growth rates to estimate the time to detectable viral load.

(A) Viral load data for viremic animals following vaginal infection (n = 5) were plotted with 15 intravenously (iv) infected animals. Viremic animals and animals sampled at days 3 and 5 fall within the animal-to-animal variability of exponential growth. Animals sampled after day 6 are outside of this range and are classified as delayed. (B) For individual viral lineages within each animal, the proportion of the total viral load is plotted with and the time each sample would reach 30 copies/ml are shown assuming a constant growth rate for each lineage. The differences in time to detectable viremia between individual lineages within the same animal can be as high as 5 days.
