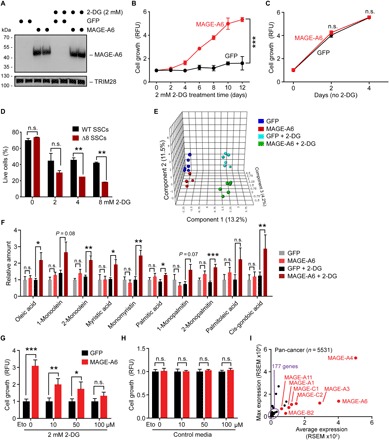
Fig. 5. MAGE-A genes promote resistance to a glycolysis inhibitor in human cancer and mouse spermatogonia stem cells.

(A) Expression of human MAGE-A6 in MIA PaCa-2 cancer cells in complete media or treated with 2 mM 2-DG for 4 days. (B and C) Human MAGE-A6 expression promotes sustained growth of MIA PaCa-2 cancer cells treated with 2 mM 2-DG glycolysis inhibitor (B), but not without (C). (D) Mage-a Δ8 SSCs are more sensitive to 2-DG than littermate control wild-type SSCs. Cells were treated with indicated doses of 2-DG for 16 hours in the absence of feeder cells before the percentage of live cells was determined by annexin-V/4′,6-diamidino-2-phenylindole staining and flow cytometry analysis. (E and F) Metabolomic analysis of MAGE-A6 expressing MIA PaCa-2 cells grown in standard media or 2 mM 2-DG for 2 to 10 days. Nontargeted metabolomics was performed by the National Institutes of Health (NIH) West Coast Metabolomics Core (n = 6). Principal components analysis (E) and relative quantities of the indicated fatty acids (F) are shown. (G and H) The carnitine palmitoyltransferase inhibitor etomoxir (Eto) reverses MAGE-A6–induced growth in the presence of 2-DG after 7 days (G) but has no effect in cells grown in complete medium without 2-DG (H). (I) Pan-cancer gene expression analysis reveals that testis-specific MAGE genes are frequently expressed in tumors (n = 5532). Data are means ± SEM from n = 3 independent experiments. P values determined by Student’s t test, *P < 0.05, **P < 0.01, ***P <0.001.
