
Fig. 3. RNA expression analysis.
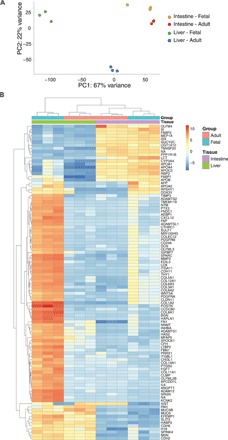
(A) Principal components analysis of the gene expression profiles. The individual samples are projected onto the first two principal components. PC1, principal component 1; PC2, principal component 2. (B) Gene expression heat map of the top 100 differentially expressed genes between adult and fetal liver and intestinal SCs. Genes are ordered by nonsupervised hierarchical clustering.