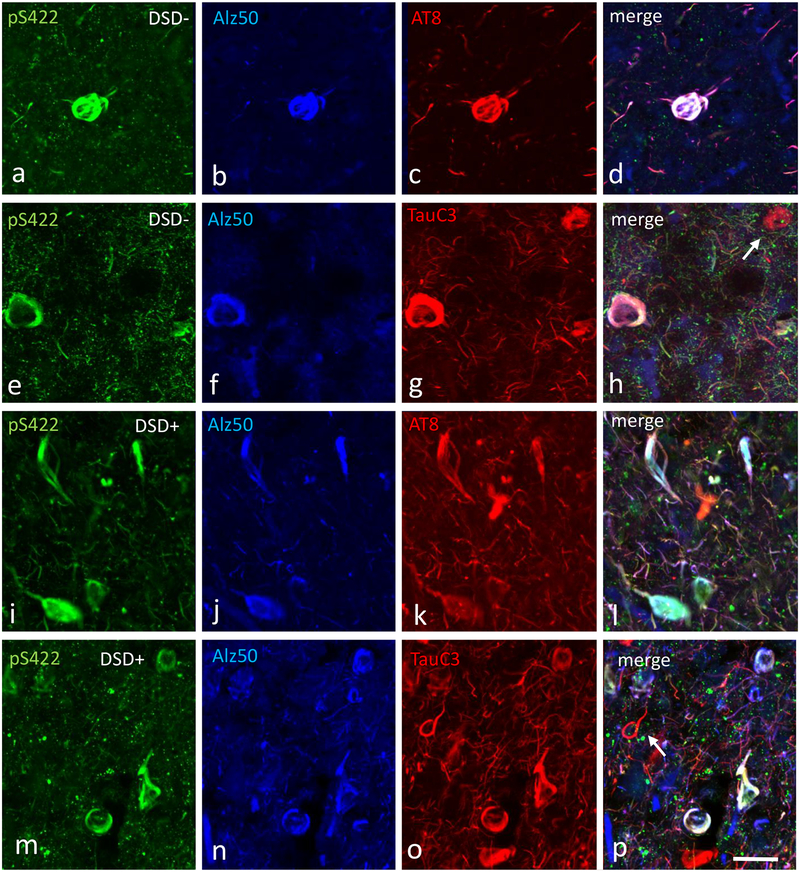
Figure 9.
Confocal immunofluorescence single-labeled images showing pS422 (green) (a, e, i, m), Alz50 (blue) (b, f, j, n), AT8 (red) (c, g) and TauC3 (red) (k, o) positive profiles and merged images (pink) (d, h, l, p) in the frontal cortex of a 44 year-old female non-demented subject with DS (a-h) and a 46 year-old demented male with DS (i-p). Note many more cortical pS422+Alz50+AT8 and pS422+Alz50+TauC3 positive NFTs and NTs (pink) in the demented cases with DS (l, p) as well the presence of single cortical TauC3 positive NFTs (white arrow) in both cases (h, p). The 50μm scale bar in p applies to all panels.

