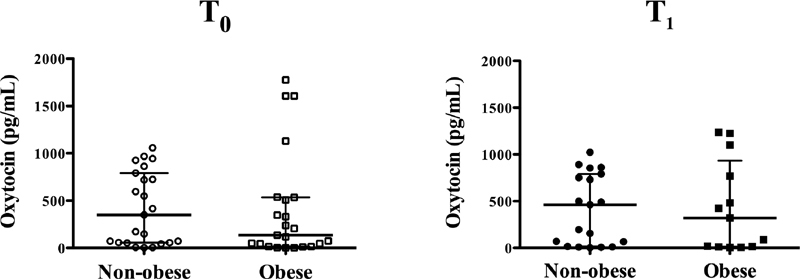
Fig. 2.

Scatter plot of plasma oxytocin level (pg/mL) in nonobese (in circles) and obese parturients (in squares) during labor induction and augmentation at time T 0 (open shapes) and T 1 (closed shapes). There were no significant differences in plasma oxytocin level either at T 0 ( p = 0.39) or at T 1 ( p = 0.95). Data represented as median and interquartile range.
