
Figure 1. CARD9 decreases susceptibility to colitis-associated cancer.
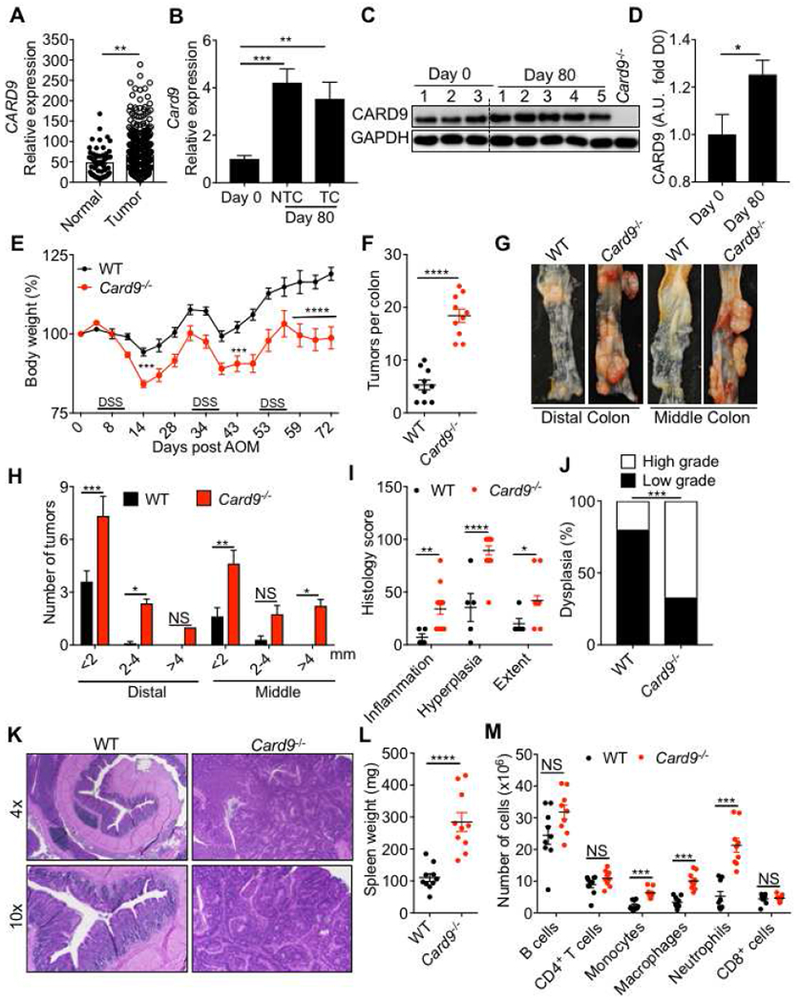
(A) CARD9 expression in normal human colon and tumor tissue from GENT database (B) Card9 expression in tumor and non-tumor colon tissue (NTC) relative to expression in the basal colon tissue (Day 0) of WT mice. (C) Immunoblot for CARD9 in colon tissue of WT mice at indicated times after AOM–DSS treatment and (D) the densitometric analysis for the CARD9 immunoblot. The last lane represents the lysate from the colon of a Card9−/− mouse on day 0. (E) Change in body weight in WT and Card9−/− mice injected with AOM on day 0 and administered with three rounds of 2% DSS in drinking water. (F) Number of tumors, (G) representative pictures of colons and (H) tumor distribution in the colons at day 80 post-AOM. (I) Colon histology scores and (J) proportion of mice with low- or high-grade dysplastic adenomas in the colons at day 80 post-AOM. (K) Representative H&E stained images at 4× and 10× magnifications of colon sections at day 80. (L) Spleen weight and (M) flow cytometric analysis of the indicated cellular populations in the spleens of WT and Card9−/− mice at day 80. Each symbol represents an individual mouse. NS, not significant; *P < 0.05; **P < 0.01, ***P < 0.001, ****P < 0.0001; Mann–Whitney U test (A, D, F and L), two-way ANOVA (E, H, I, M), one-way ANOVA followed by the Holm–Sidak post-hoc test (B) or Fisher’s exact test (J). Data are from one experiment representative of two independent experiments with n = 5-10 mice per group (A-M; mean and SEM [A, B, D, E, F, H, I, L and M]). See also Figure S1.