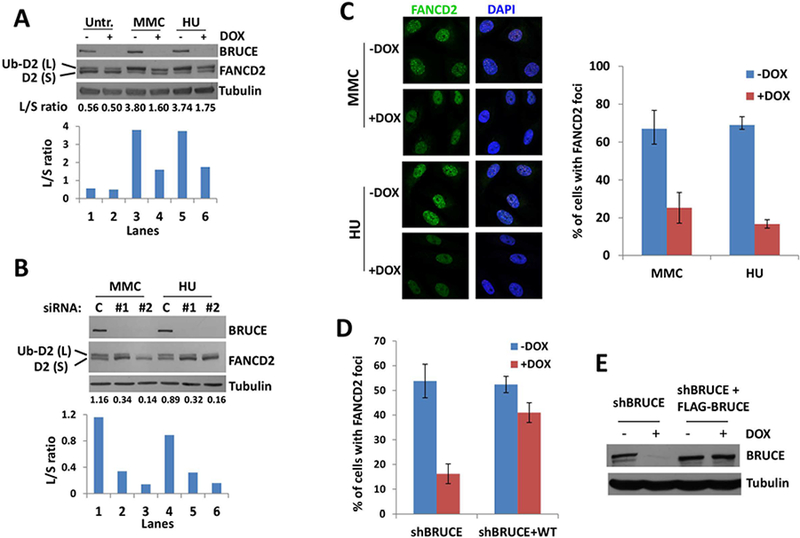
Fig. 3. BRUCE is required for activation of the ATR-FA pathway.

(A) U2OS shBRUCE cells were treated with DOX to deplete BRUCE. MMC or HU were added to medium at day 3 with final concentrations of 1 μm and 2 mM, respectively. After another 24 hrs culture, cells were collected and subject to immunoblot against BRUCE, FANCD2 and Tubulin. Lower bar graph represents the intensity ratio between FANCD2 large band (Ub-D2) and small band (D2); quantification was carried out with ImageJ software.
(B) U2OS cells were depleted of BRUCE by two distinct siRNAs and treated (or mock treated) with MMC or HU for 24 hrs with a final concentration of 1 μm and 2 mM, respectively. Cells were collected and subject to immunoblot against BRUCE, FANCD2 and Tubulin. The lower bar graph represents the intensity ratio of the FANCD2 large band (Ub-D2) and the small band (D2), quantification was performed with ImageJ software.
(C) U2OS shBRUCE cells were depleted of BRUCE by DOX and treated with 1 μm MMC or 2 mM HU for 24 hours. Cells were fixed and stained for FANCD2 foci. Representative images are shown and quantification of FANCD2 foci is displayed on the right, bars represent SD from a triplicate experiment.
(D) Quantification of FANCD2 foci in U2OS shBRUCE cells and shBRUCE cells reconstituted with FLAG-BRUCE (shBRUCE+WT). Error bars represent SD from a triplicate experiment.
(E) Western blot showing abolished BRUCE expression in shBRUCE cells treated with DOX and recovery of BRUCE in shBRUCE cells reconstituted with FLAG-BRUCE (shBRUCE+WT).
