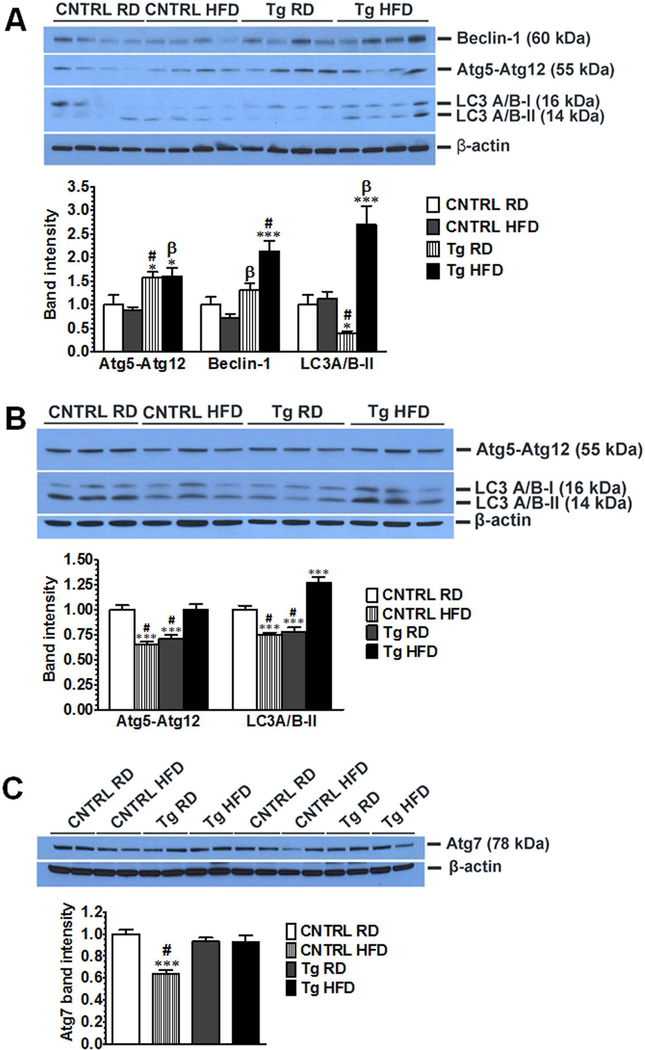
FIG. 1.
GDNF prevents high fat diet-induced reduction in the levels of components of the autophagic pathway in mouse liver. Western blot analysis of (A) Beclin-1, Atg5, and LC3A/B levels in liver from male control (CNTRL) and GDNF transgenic (Tg) mice fed a RD or HFD for 12 weeks. β-actin was used as a loading control. Histogram shows fold change relative to RD-fed control mice of band intensities per β-actin band intensities. Plotted are means + SEM (***, P<0.001; *, P<0.05 relative to CNTRL RD; #, P<0.001; β, P<0.01 relative to CNTRL HFD. n = 4 mice in each group). (B) Western blot analysis of Atg5 and LC3A/B protein levels in liver from female control (CNTRL) and GDNF transgenic (Tg) mice fed a RD or HFD for 12 weeks. Plotted are means + SEM (***, P<0.001 relative to CNTRL RD; #, P<0.001 relative to Tg HFD. n = 3 mice per group). (C) Western blot analysis of Atg7 protein levels in liver from female control (CNTRL) and GDNF transgenic (Tg) mice fed a RD or HFD for 12 weeks. Plotted are means + SEM (***, P<0.001 relative to CNTRL RD; #, P<0.001 relative to Tg HFD. n = 4 mice per group).

