
Figure 2. HBV DNA levels.
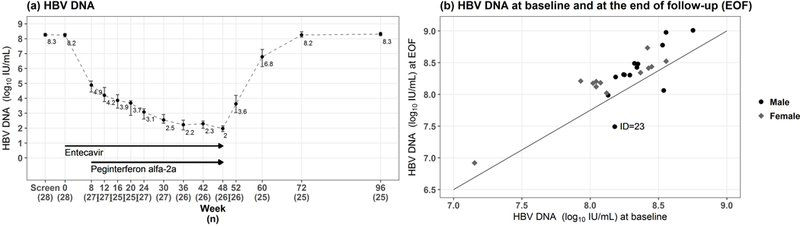
(a) Median and 95% confidence intervals (CI) of HBV DNA levels are shown at baseline, during and after treatment. (b) HBV DNA levels at baseline are plotted against HBV DNA at the end of follow-up (week 96) indicating that HBV DNA levels returned to near-baseline levels (>107 IU/mL) in all participants including the individual who cleared HBeAg at the end of follow-up.