
Figure 3.
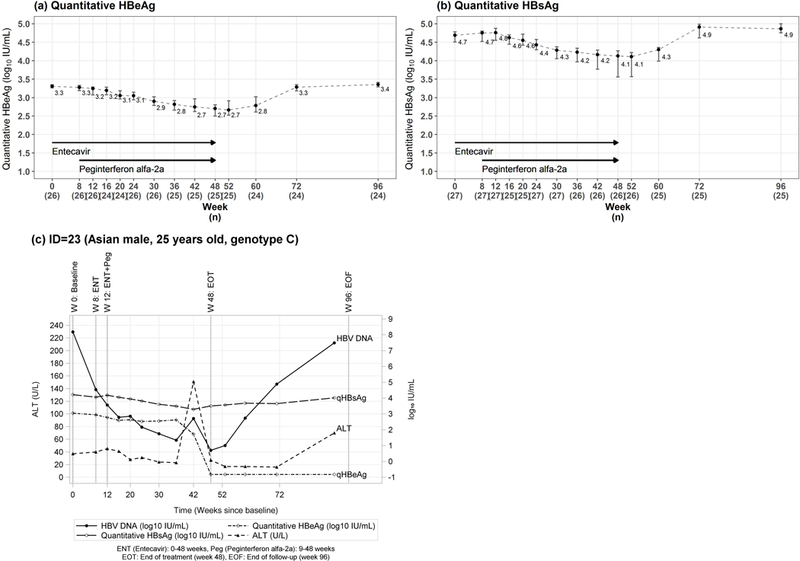
(a) Quantitative HBeAg, (b) quantitative HBsAg, and (c) labs over time in the participant who had HBeAg seroconversion quantitative (a) HBeAg and (b) HBsAg levels are shown before, during and after treatment. (c) The pattern of ALT, HBV DNA and quantitative HBsAg, HBeAg are shown in the individual who underwent HBeAg seroconversion on treatment. This patient stopped peginterferon at week 35 due to a diagnosis of Graves disease but continued entecavir until week 48. The decrease in HBeAg and HBsAg levels and sharp rise in ALT levels occurred after peginterferon was stopped and before entecavir was discontinued. The week 48 line indicates the end of entecavir treatment and the first time HBeAg was found to be negative.