
Figure 4. ALT levels.
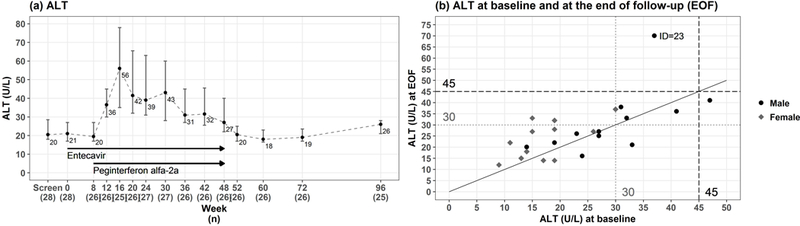
(a) Median and 95% CI of ALT levels are shown before, during and after treatment. (b) ALT levels at baseline are plotted against ALT levels at end of follow-up (week 96) indicating that ALT levels returned to near-baseline levels in most participants. ALT values of 1.5 ULN are indicated for men (45 U/L) in dashed lines and women (30 U/L) in dotted lines, respectively.