
Figure 2A and 2B.
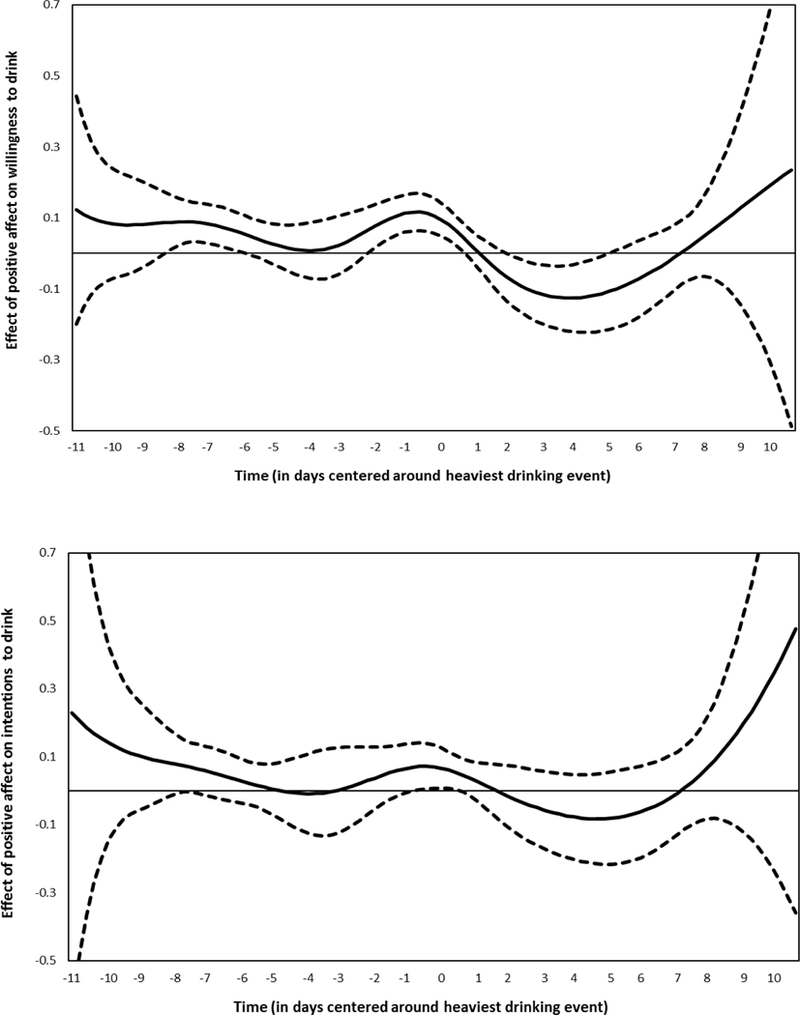
Time-varying effect of positive affect on willingness (2A; top) and intentions (2B; bottom) to drink. Dotted lines indicate 95% confidence intervals. Time is measured and analyzed continuously but is centered and labeled in daily intervals for ease of presentation