


Figure 3.
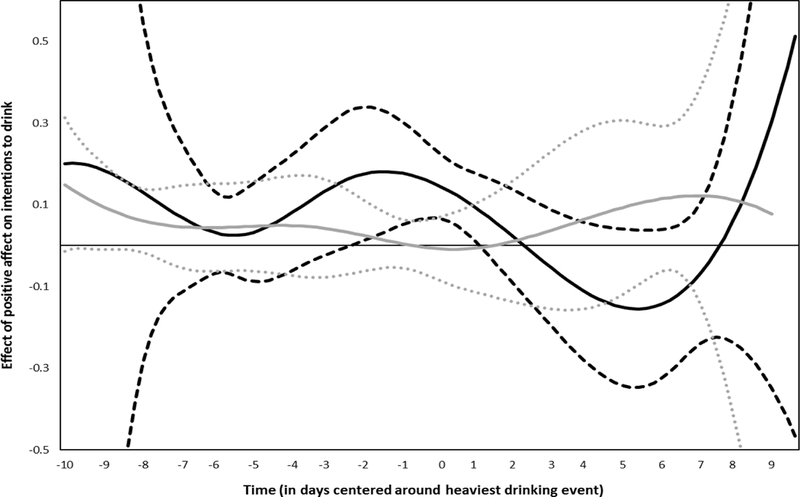
Time-varying moderated effect of anxiety on positive affect and intentions to drink. Dotted lines indicate 95% confidence intervals. Black dashed lines represent low anxiety and gray dotted lines represent high anxiety. Time is measured and analyzed continuously but is centered and labeled in daily intervals for ease of presentation