
Figure 2. Timeline of events.
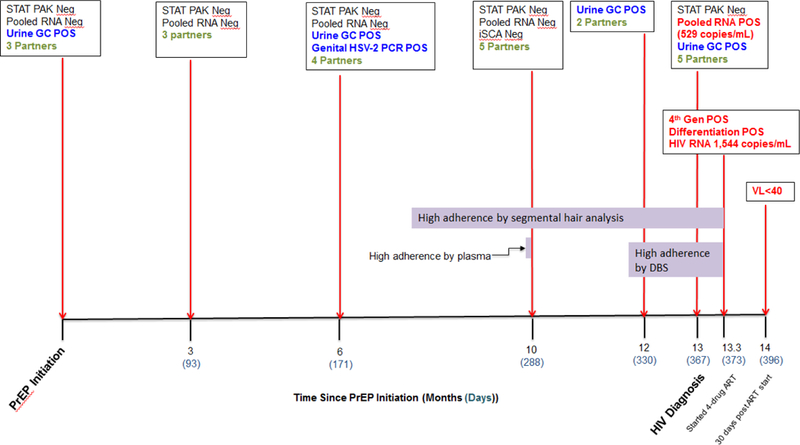
HIV testing results, positive STD tests and number of sex partners at each visit from PrEP initiation through HIV diagnosis and virologic suppression. Number of sex partners (green) are the self-reported total number of sex partners in the prior three months. Horizontal bars (purple) represent the time period reflected by the specific pharmacologic adherence measure, i.e. plasma levels measure adherence over the prior one to three days, DBS over the prior six weeks and hair over the prior six months.