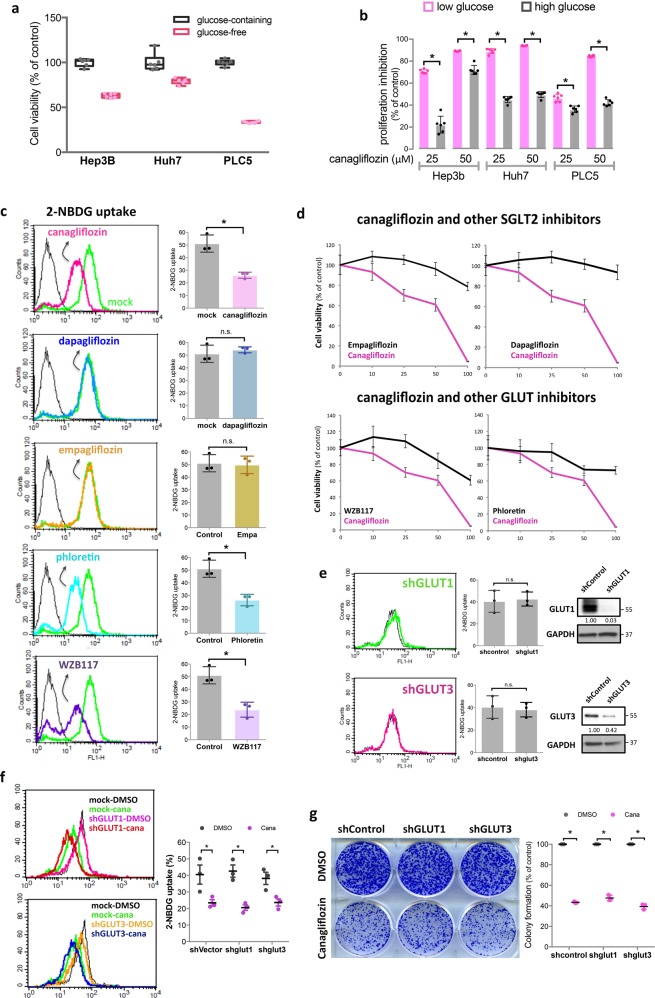
Fig. 2. CANA exerts glucose-blockage-independent mechanism against HCC.
a Glucose-depletion environment compromised the proliferation of HCC cells. Cellular viabilities of the indicated cell lines in glucose-containing and glucose-free environments were measured by MTT assay. Bar, mean; error bar, S.E. b The anti-HCC effects of CANA were diminished in a high-glucose-containing environment. HCC cells maintained in low-glucose (12.5 mM) and high-glucose (25 mM)-containing media were treated with CANA for 48 h, and assessed by MTT. Bar, mean; error bar, S.E; *P < 0.05. c CANA and GLUT inhibitors, not other SGLT2 inhibitors, reduced glucose uptake of HCC cells. A 2-NBDG glucose uptake assay was conducted to estimate the effects of five different glucose transporter inhibitors, including CANA, dapagliflozin, and empagliflozin (the SGLT2 inhibitor class), and phloretin and WZB117 (the GLUT inhibitor class), on blocking glucose uptake by Huh7 cells. Representative histograms from flow cytometry testing the indicated compounds (left panel) showed that CANA, phloretin and WZB117 reduced cellular glucose uptake (peak of 2-NBDG shifted to the left), but dapagliflozin and empagliflozin did not (peak of 2-NBDG overlapped with that of mock). Results of each compound in triplicated tests were quantified and are shown on the right side. d Comparison of the anti-HCC effects of CANA (pink) and the four other glucose inhibitors (black). N = 3. Point, mean; error bar, S.E. e Knockdown of GLUT1 or GLUT3 was not sufficient to reduce cellular glucose uptake significantly. Left panel shows the representative 2-NBDG uptake histograms of GLUT1- or GLUT3-silencing cells, the middle panel shows the results of triplicated tests, and the right panel represents the western blot of GLUT1 and GLUT3 expression in these mock and genetically manipulated cells. The numbers listed below each band indicated its relative strength. f, g The effects of CANA on reducing glucose uptake (f) and growth inhibition (g) were not significantly affected by either GLUT1- or GLUT3- knockdown. Representative histogram of 2-NBDG uptake and colony formation assay are shown on the left side of each subfigure, and the quantified results are shown on right side. N = 3, Bar, mean; error bar, S.E

