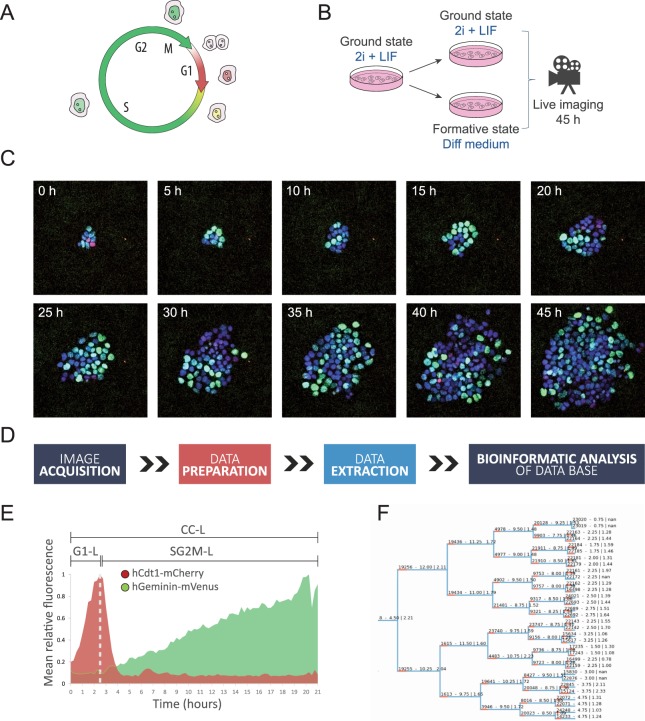
Figure 1.
Live imaging and bioinformatic data acquisition. (A) Diagram of the Fucci System. (B) Experimental approach. (C) Time-lapse images of a representative FUCCI-H2B colony in naive ground state conditions growing for 45 h. Fluorescent images are merged compositions of the three channels corresponding to hCd1-mCherry (G1), hGeminin-mVenus (SG2M) and H2B-mCerulean (nuclear marker). (D) Schematic of the different steps performed to acquire and analyze single cell live imaging data. (E) hCd1-mCherry and hGeminin-mVenus fluorescence dynamics for a representative cell over time. CC-L was defined as the length of time since a cell was born and up to its division, deduced by mitotic events analyzed with the H2B nuclear marker. G1-L was defined as the time since a cell was born and up to the local maximum of the hCd1-mCherry fluorescence, while SG2M-L was calculated as the difference between CC-L and G1-L. (F) Representative dendrogram reconstructed for a lineage of cells growing in differentiating conditions.

