Figure 4.
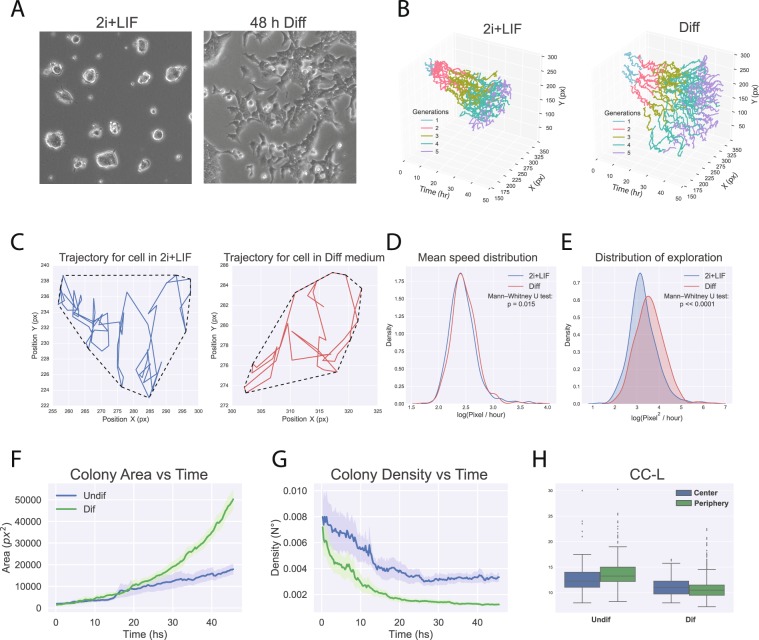
Morphological reorganization of mESCs during the transition to formative pluripotency. (A) Morphology of cells cultured in 2i + LIF or after 48 h of culture in Diff medium. (B) Individual cell trajectories over time for cells within representative colonies maintained in 2i + LIF or in Diff medium. Cell generation numbers are indicated in colors. (C) Blue and red lines show spatial trajectories for representative cells cultured in ground state conditions or in Diff medium. Dashed lines surrounding the trajectories depict their convex hull. (D) Distribution of mean cell speeds for cells grown in 2i + LIF or in Diff medium, calculated for each cell as the total trajectory divided by the CC-L. N = 516 and 623 cells for naive ground state and differentiation, respectively. Data was transformed to log scale for visualization and analyzed for statistical differences with a Mann Whitney U test. (E) Distribution of cell exploration for cells grown in 2i + LIF or in Diff medium, calculated for each cell as the convex hull area divided by the CC-L. Data was transformed to log scale for visualization and analyzed for statistical differences with a Mann Whitney U test. (F) Colony area vs Time for colonies maintained in 2i + LIF or in Diff medium. N = 11 and 12 colonies for 2i + LIF and Diff medium, respectively. Shaded areas show the 95% confidence interval. (G) Colony density vs Time for colonies maintained in 2i + LIF or in Diff medium. N = 11 and 12 colonies for 2i + LIF and Diff medium, respectively. Shaded areas show the 95% confidence interval. (H) CC-L distribution for center and peripheral cells in 2i + LIF or in differentiating conditions.

