Figure 5.
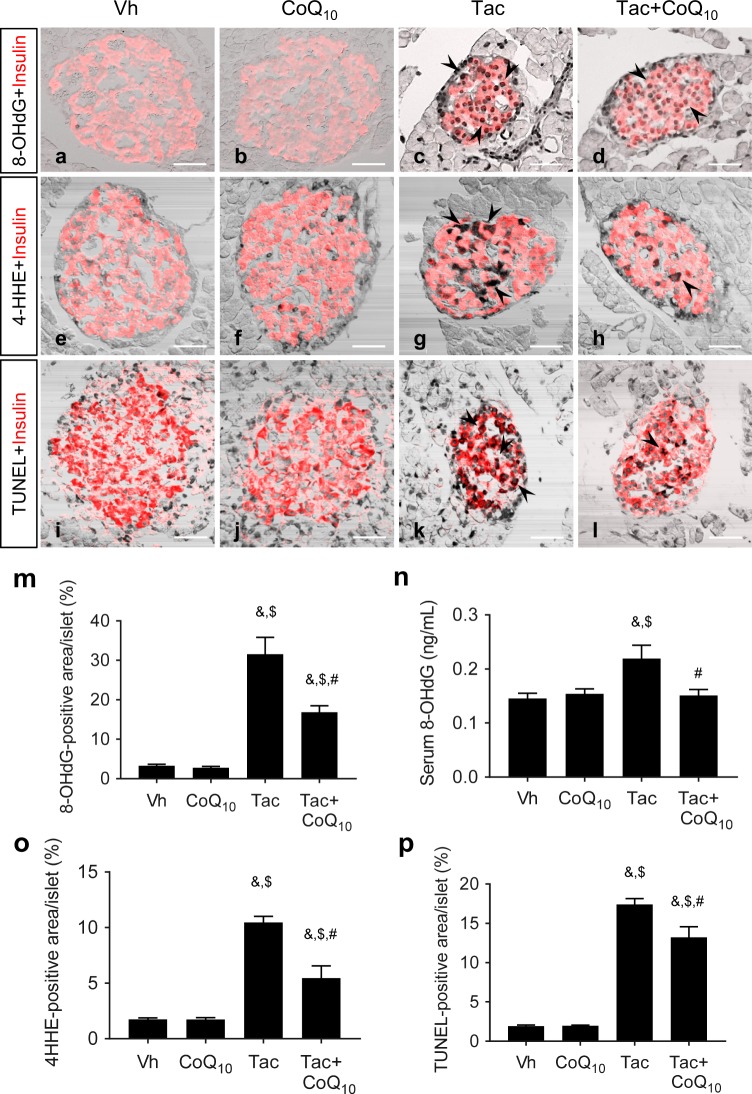
Effects of CoQ10 on oxidative stress and apoptosis in pancreatic islets and sera during Tac-induced DM in rats. Representative images and quantification of immunohistochemistry for 8-OHdG (a–d,m) and 4-HHE (e–h,o) and TUNEL assays (i–l,p) using tissue sections from rats. (n) Serum 8-OHdG excretion. Arrowheads indicate 8-OHdG-, 4-HHE-, and TUNEL-positive cells. Scale bar = 50 µm (all panels). Data are presented as the mean ± SE (n = 8). One-way ANOVA was used to analyze the data. &P < 0.05 versus the Vh group; $P < 0.05 versus the CoQ10 groups; #P < 0.05 versus the Tac group.

