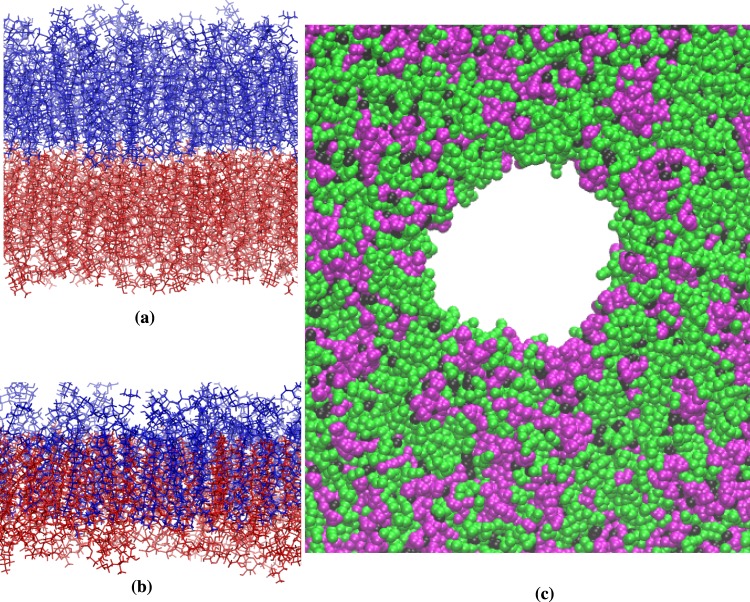
Figure 5.
Representative snapshots for GalCer-rich membrane. (a) Equilibrium and (b) interdigitation (at 70 mN/m surface tension) states at 0.6 μs of atomistic simulation. The lipid molecules in upper and lower leaflets are shown in blue and red colors, respectively. (c) Close-up of a pore from CG-GalCer-rich (42 nm) at 0.15 μs of simulation. POPC/POPE molecules are shown as green, CHOL as black, and GalCer as magenta with VDW representations. The water and ion molecules are removed for clarity.

