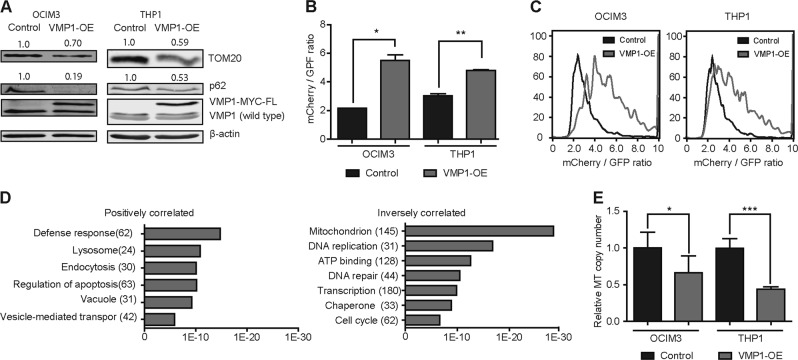
Fig. 4. Overexpression of VMP1 increases autophagic-flux in leukemic cells and is involved in mitochondrial turnover.
a Western blot analysis of TOM20, p62 and VMP1 in OCIM3 and THP1 cells overexpressing VMP1 (VMP1-OE) or control. b The mCherry/GFP ratio determined in mCherry-GFP-LC3 expressing leukemic cell lines, transduced with control or VMP1 OE. c Representative FACS of the mCherry/GFP ratio analysis in OCIM3 and THP1 cells. d Gene ontology analysis (David) was performed on two large AML patient gene expression datasets. Figures showing p-values of enriched gene sets, positively (left graph) or inversely (right graph) correlated with VMP1 expression in AMLs. e Mitochondrial copy number in OCIM3 and THP1 cells with VMP1-OE or control. Error bars represent SD; * or ** represents p < .05 or p < .01, respectively

