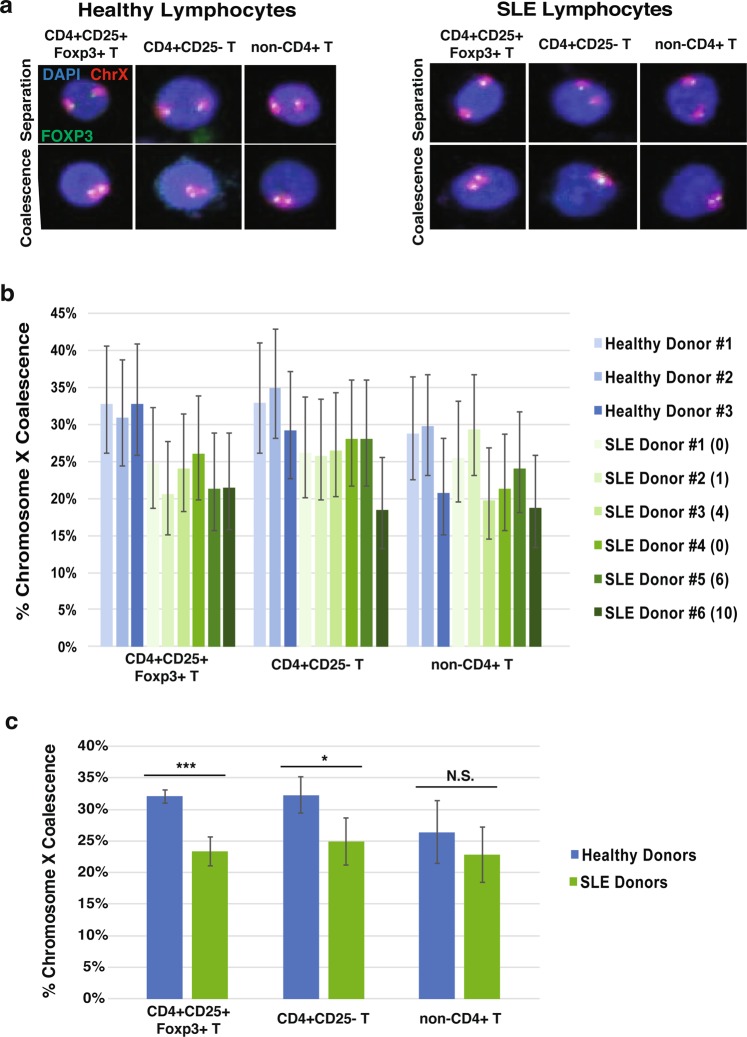
Figure 6.
Human female systemic lupus erythematosus (SLE) CD4+ T lymphocytes exhibit significant differences in chromosome X organization compared to healthy controls. (a) 3D maximum intensity projections of human female healthy (left panels) and SLE (right panels) lymphocyte nuclei (blue) with FOXP3 (green) and chromosome X (red) labeled during X separation (top panels) and coalescence (bottom panels). (b) 3D chromosome X coalescence frequency of healthy and SLE regulatory T cells (CD4 + CD25 + Foxp3+), CD4 + CD25- T cells, and non-CD4+ T cells. Each column represents approximately 150 nuclei analyzed, error bars designate 95% confidence intervals. SLEDAI-2 donor score given in parenthesis. (c) Chromosome X coalescence frequency of healthy and SLE regulatory T cells (CD4 + CD25 + Foxp3+), CD4 + CD25- T cells, and non-CD4+ T cells. Values presented as mean ± standard deviation. *P < 0.05, **P < 0.01, ***P < 0.001, NS. = Not Significant, Student’s t-test. Each column represents approximately 450 healthy or 900 SLE nuclei analyzed.

