Figure 3.
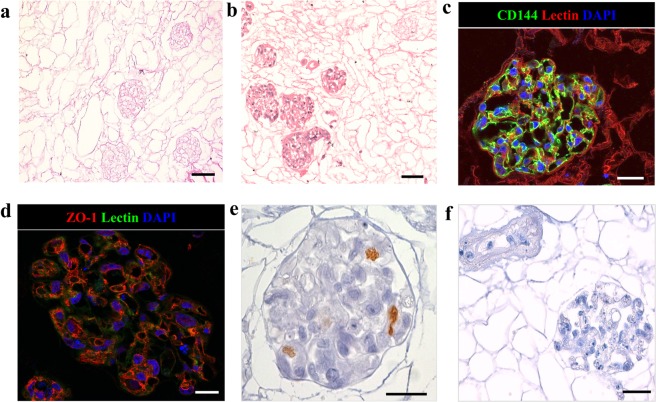
Repopulation of kidney scaffold with iPSC-derived ECs delivered by renal artery. (a) Hematoxylin and eosin staining on decellularized kidney scaffold. Scale bar 50 μm; (b) Hematoxylin and eosin staining shows cellular distribution mainly in glomerular structures. Scale bar 50 μm; (c) Immunofluorescence for CD144 showing iPSC-derived ECs in the glomerular capillary. Scale bar 25 μm; (d) ZO-1 staining. Scale bar 20 μm; (e) Ki67 staining. Scale bar 20 μm; (f) Isotype antibody staining used as negative control. Scale bar 50 μm.

