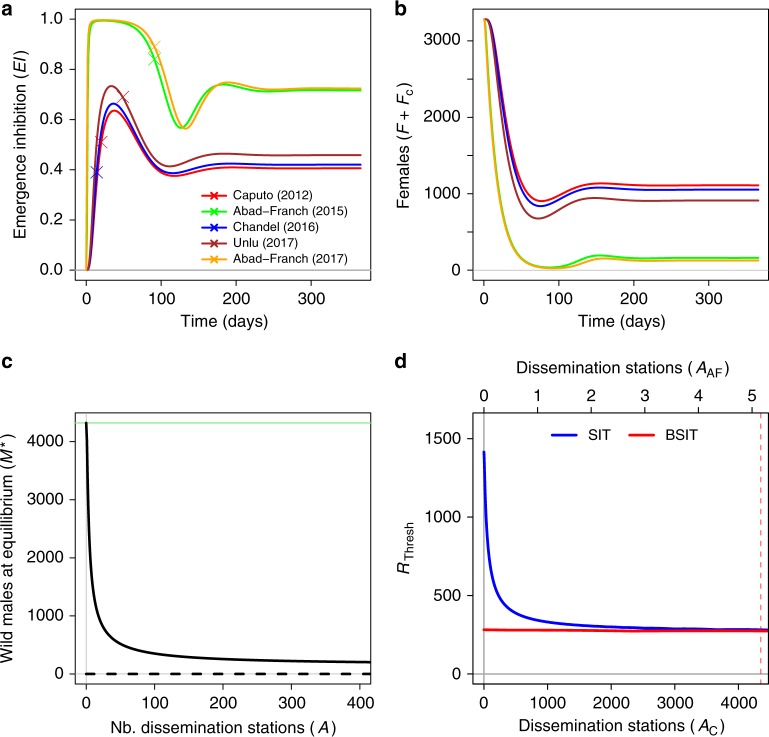
Fig. 3.
Trajectories, equilibria and thresholds with ADT. Trajectories of emergence inhibition under ADT, and calibration points taken from five field trials (a). Corresponding trajectories of total female density (b). Stable (solid) and unstable (dashed) equilibria of the ADT model as a funciton of dissemination station density (c). The response of the elimination thresholds (blue) and (red) to dissemination station density (d), where AC indicates dissemination station density when contamination rate α is estimated from Caputo et al.12, and where AAF indicates dissemination station density when α is estimated from Abad-Franch et al.18 (Supplementary Table 3). The vertical pink dashed line indicates the dissemination station density required for to equal with A = 0 (intercept of red line)

