Fig. 4.
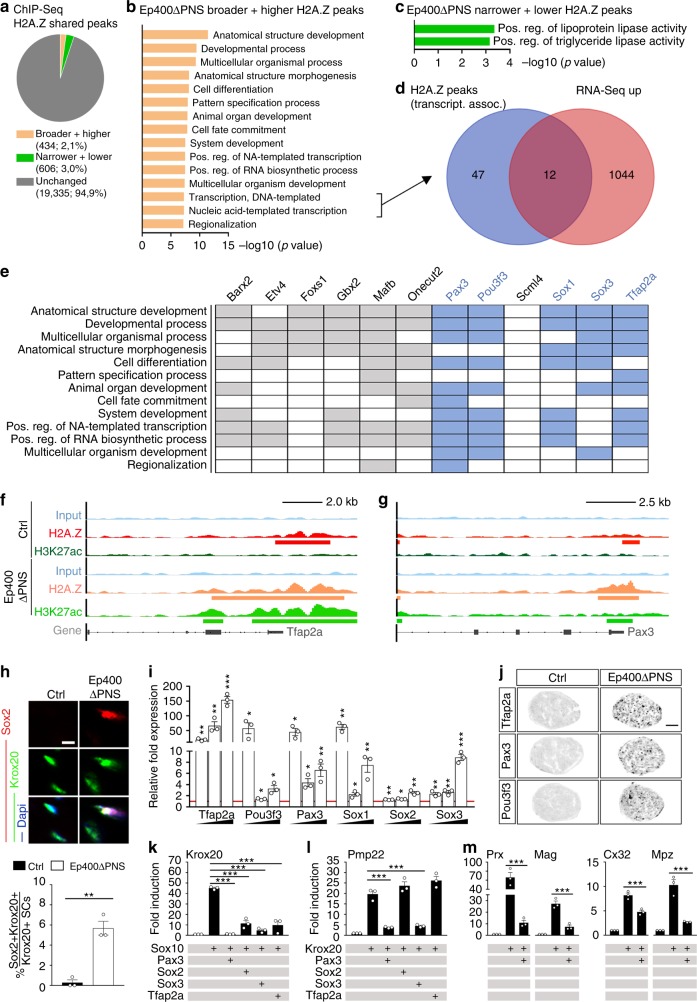
Aberrant H2A.Z occupancy and expression of developmental transcription factor genes in Ep400ΔPNS nerves. a Pie chart of shared H2A.Z peaks grouped as unchanged (dark gray), broader and higher (ochre) or narrower and lower (green) in Ep400ΔPNS nerves at P9. b, c Gene ontology terms (GORILLA) enriched among genes with broader and higher (b) or narrower and lower (c) H2A.Z peaks in Ep400ΔPNS nerves, sorted by statistical significance. d Venn diagram showing overlap between upregulated genes and transcription-related genes with broader and higher H2A.Z peaks in Ep400ΔPNS nerves. e Biological processes linked to upregulated transcription factors (blue, further analyzed) with broader and higher H2A.Z peaks in Ep400ΔPNS nerves. f, g H2A.Z (red), H3K27ac (green), and input (blue) tracks for Tfap2a (f) and Pax3 (g) genes in control (dark colors) and Ep400ΔPNS nerves (light colors) with peaks marked below the tracks. h Immunofluorescent visualization and quantification of Sox2 expressing (red) Krox20-positive (green) Schwann cells in control and Ep400ΔPNS sciatic nerve sections at P21 (n = 3; mean values ± SEM). i Reverse transcriptase PCR quantification of Tfap2a, Pou3f3, Pax3, Sox1, Sox2, and Sox3 transcripts in Ep400ΔPNS sciatic nerves at increasing age (P9, P21, and 2 months from left to right, indicated by triangle) as compared to age-matched control (arbitrarily set to 1 and marked by red line; n = 3; mean values ± SEM; statistics performed between control and Ep400ΔPNS mice for each gene and age). j In situ hybridization for Tfap2a, Pax3, and Pou3f3 on control and Ep400ΔPNS sciatic nerve sections at P21. k–m Activation of luciferase reporters under control of Krox20 (k), Pmp22 (l), Periaxin (Prx), Mag, Connexin32 (Cx32), and Mpz (m) regulatory regions in transiently transfected Neuro2a cells by Sox10, Krox20, Pax3, Sox2, Sox3, Tfap2a, and combinations (n = 3; presented as fold inductions ± SEM, transfections without added transcription factors set to 1 for each regulatory region). Scale bars: 5 µm (h), 50 µm (j). Statistical significance was determined by unpaired two-tailed Student’s t test (h, i) or analysis of variance (k–m) (*P ≤ 0.05; **P ≤ 0.01; ***P ≤ 0.001). Exact values are listed in Supplementary Tables 6–8 and source data are provided as a Source Data file

