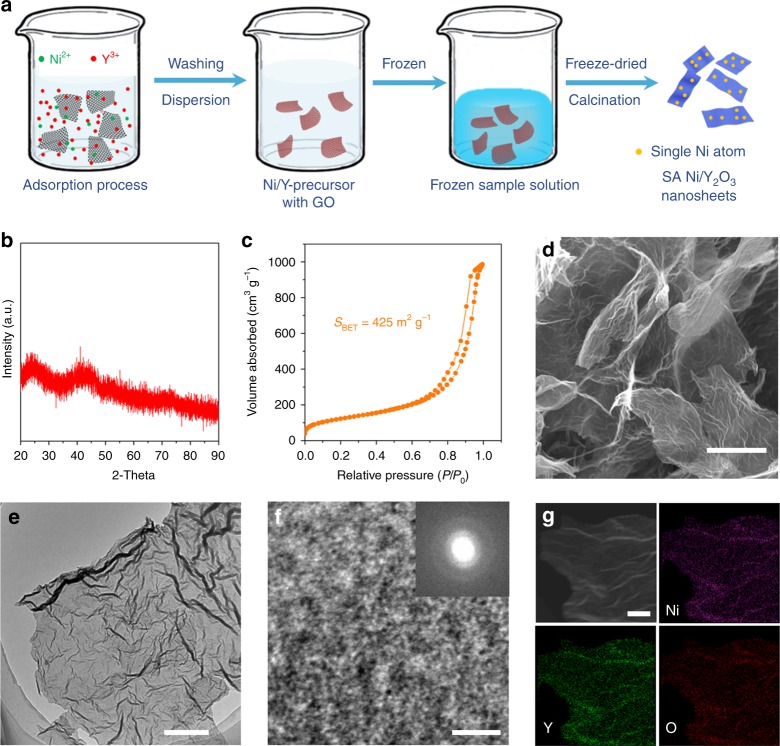
Fig. 2.
Preparation and characterization of the SA Ni/Y2O3 nanosheets. a Schematic of the preparation process for Y2O3 nanosheets decorated with single Ni atoms (SA Ni/Y2O3). b XRD pattern, c N2 adsorption–desorption isotherm, d SEM image, e TEM image, f HRTEM image, g STEM image, and EDS mapping images of Ni, Y, and O of the SA Ni/Y2O3 nanosheets. The inset in f is the corresponding electron diffraction pattern. The scale bars in d, e, f, and g are 1000, 200, 2, and 20 nm, respectively

