Figure 5.
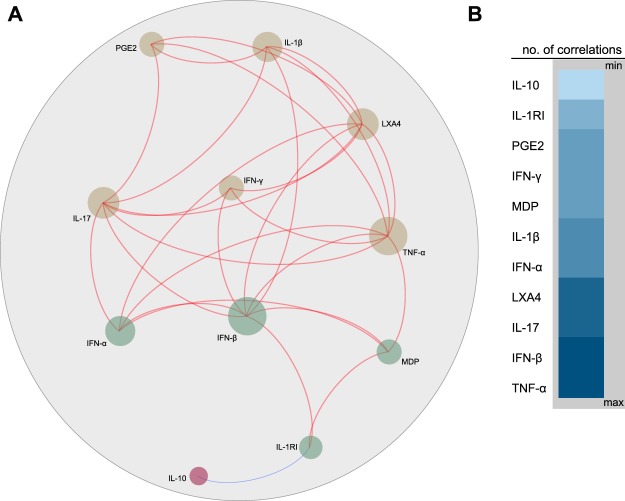
Network analysis of the molecular degree of perturbation score values in all participants from India and China. A Spearman correlation matrix including the molecular degree of perturbation values for each biomarker as well as the single sample molecular degree of perturbation was built. (A) Network illustrates strong Spearman correlations (p < 0.001; Spearman rank value > 0.7 or <−0.7). Markers were clustered based on a similarity index of the correlation profiles using a modularity algorithm and depicted with Fruchterman Reingold (force-directed graph drawing). Using this approach, three main nodes were detected. Only markers which had strong correlations were plotted to reduce visual pollution. Red lines represent positive while blue lines indicate negative correlations. (B) Node analysis was used to illustrate the number of strong correlations per marker. Markers were grouped according to the number of connections from minimum to maximum numbers detected.

