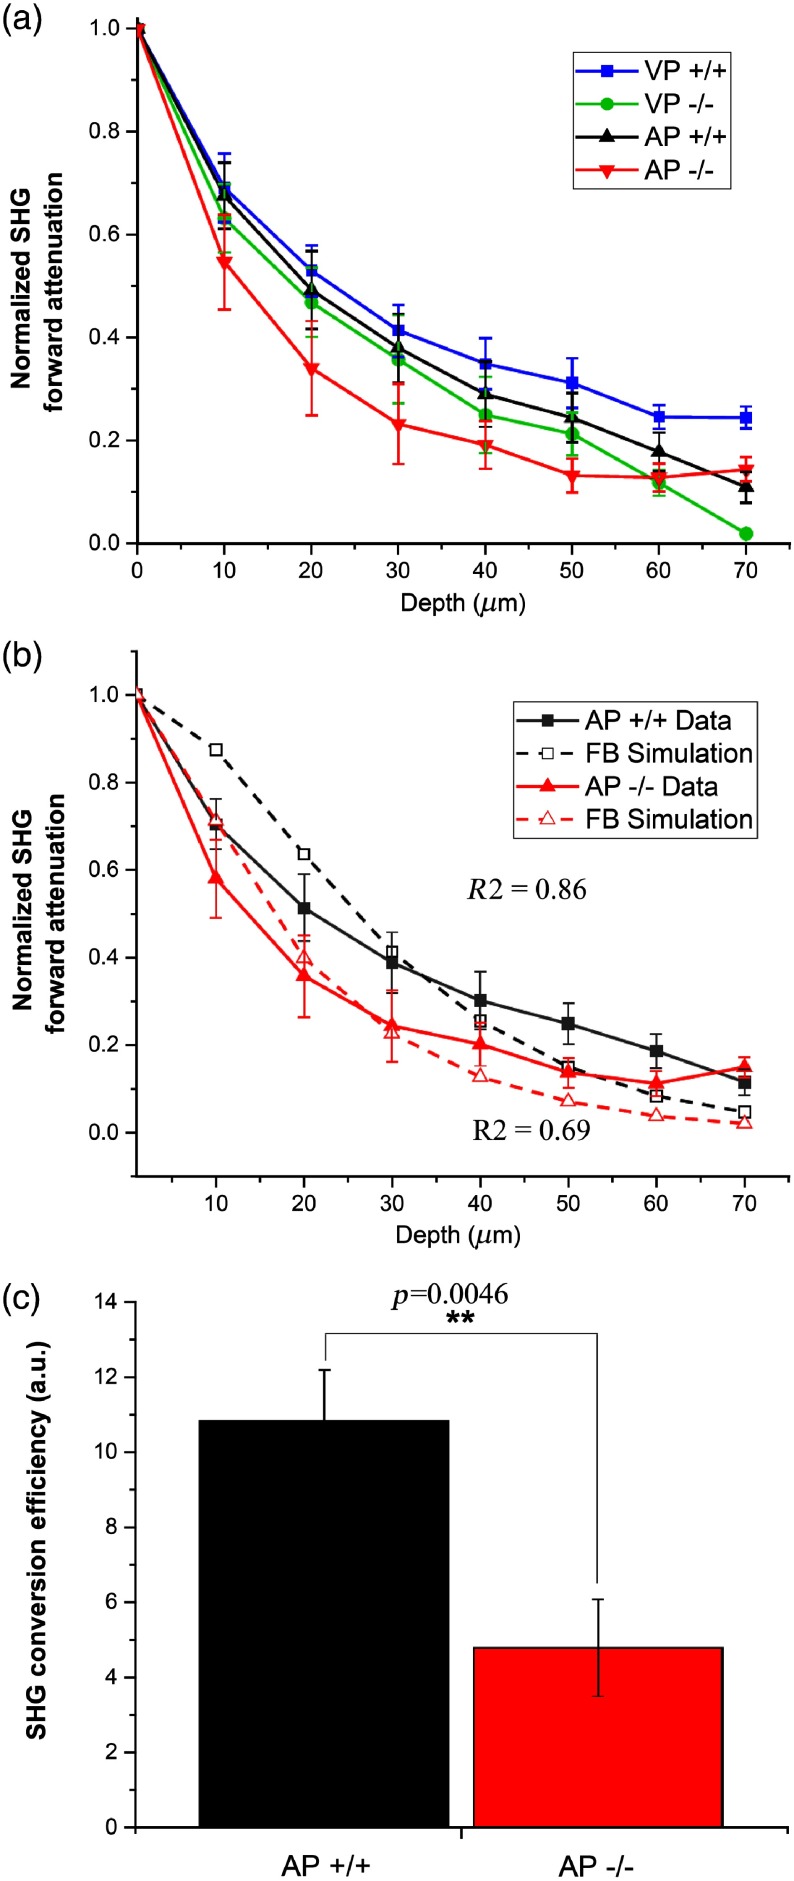
Fig. 2.
(a) Forward SHG emission attenuation curves (intensity versus depth) for the four tissue types, normalized by peak power per series every . Each line represents the of . No significant change is detected in the VP lobes. (b) Best-fit Monte Carlo simulations to the experimental data of the and based on the primary and secondary filers and guesses to the conversion efficiency. The values between the data and best simulation are 0.86 and 0.69 for the wt and , respectively. (c) Bar graph of the extracted SHG conversion efficiencies for the AP gland, where the has significantly lower SHG conversion efficiencies compared to wt ().

