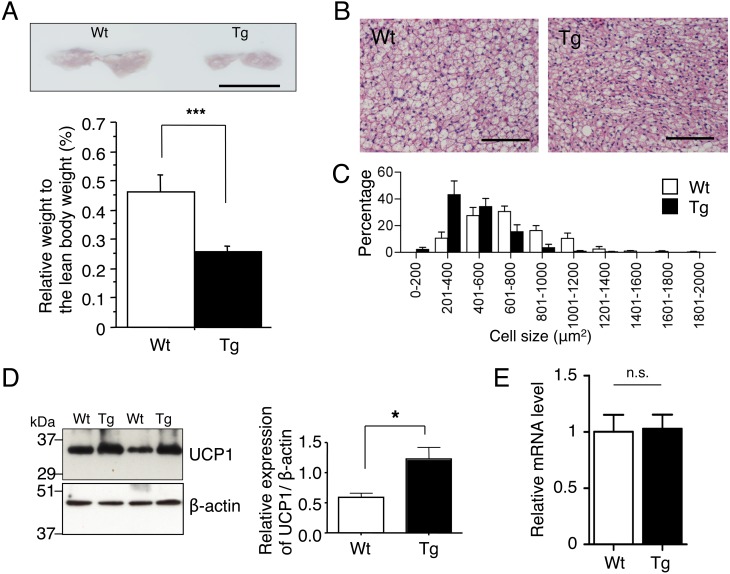
Fig. 2.
Characteristics of iBAT in TgActβE mice. (A) Gross appearance of iBAT of the mice (upper panel). Representative data are shown. Bar, 1 cm. Relative tissue weight expressed as a percentage of total body weight (lower panel). n=11–12 in each group (15–17 weeks old). (B) Histological analysis of iBAT (18 weeks old). Adipose tissue sections were stained with HE. Representative data are shown. Bar, 100 µm. (C) Distribution of the cell size in iBAT. The tissue sections were stained with HE. The adipocyte size in arbitrary fields of view was analyzed by ImageJ (NIH). Results are shown as means ± SEM. n=7 in each group (15–17 weeks old). (D) Western blot analysis of UCP1 expression in iBAT. Representative data are shown (left panel). Densitometric values of UCP1 expression are shown (right panel). n=4 in each group (11–15 weeks old). (E) UCP1 mRNA expression in iBAT. The mRNA was subjected to RT-qPCR. UCP1 expression was normalized to Hprt1 expression. The expression level in the control mice was set to 1. n=4 in each group (24–27 weeks old). Values are mean ± SEM. *P<0.05, ***P<0.005.

