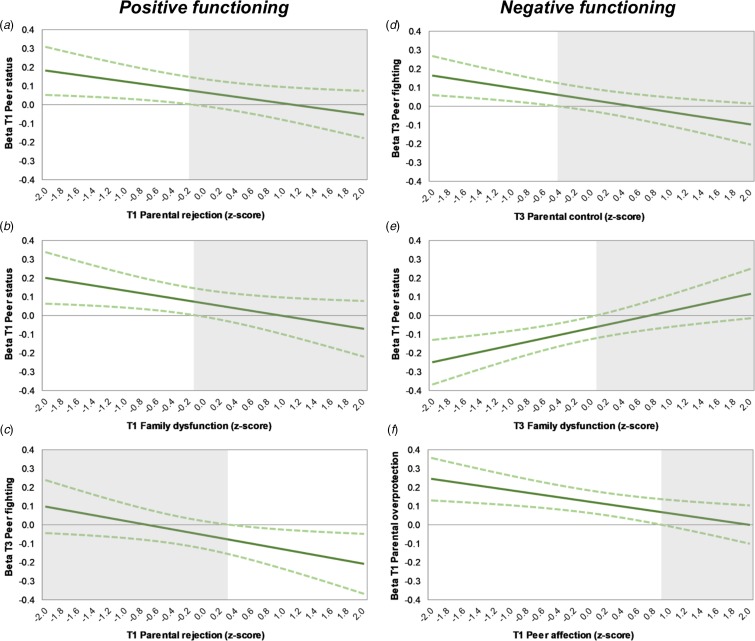
Fig. 3.
Johnson–Neyman plots showing (a) the conditional effect of T1 peer status for T1 parental rejection, (b) of T1 peer status for T1 family dysfunction, and (c) of T3 peer fighting for T1 parental rejection on young adult positive functioning, and (d) the conditional effect of T3 peer fighting for T3 parental control, (e) of T1 peer status for T3 family dysfunction, and (f) of T1 parental overprotection for T1 peer affection on young adult negative functioning (c). The non-shaded areas indicate regions-of-significance. For ease of interpretation, scores for negative functioning were reversed back such that a higher score indicates more negative functioning.

