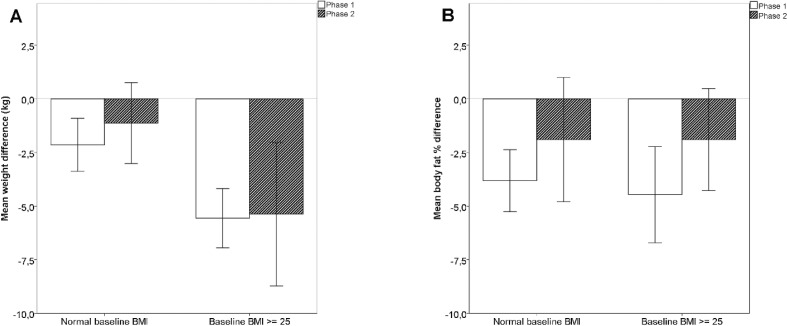
Fig. 2.
Changes in weight and body fat in body mass index subgroups. (A) Mean reductions of body weight according to baseline BMI. The differences between BMI subgroups are significant, P < 0.001 for phase 1 and P = 0.025 for phase 2. (B) Mean reductions in body fat percentage according to baseline BMI, the differences between BMI subgroups are not significant. Error bars represent 95% CI.

