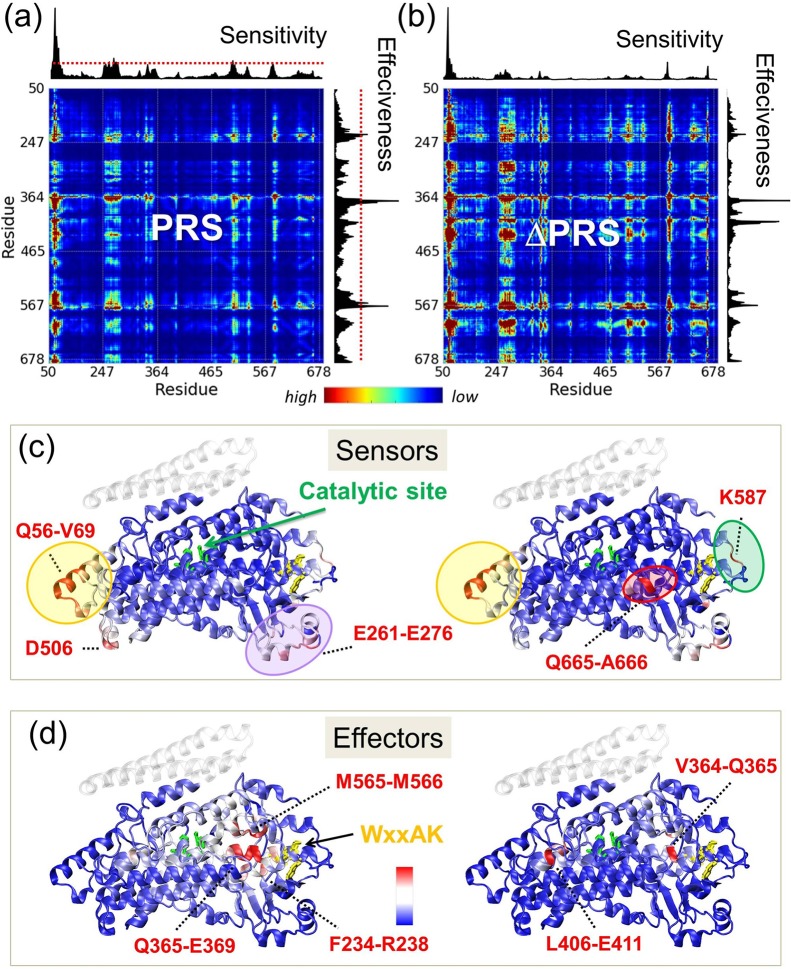
Figure 4.
Evaluation of the role of LOX residues as sensors and effectors of allosteric signals and the variations among family members. (a) Average PRS heat map and (b) its standard deviation among LOX family members. The bar plots on the upper abscissa (sensitivity) and right ordinate (effectiveness) describe the propensity of residues to serve as sensors and effectors, respectively. The highest values represent the strongest sensors and effectors, shown in red on the 3D structure of pLoxA in the left parts of panels c and d. Dotted red lines mark the cutoff for defining the strongest sensors and effectors. (c-d) Structures colored by sensitivity (c) and effectiveness (d) propensities. Catalytic residues are shown in green sticks, and the WxxAK motif is shown in yellow sticks. The diagrams on the right in the respective panels c and d highlight the regions where maximal differentiation in the respective sensor and effector properties are observed among LOXs family members.

