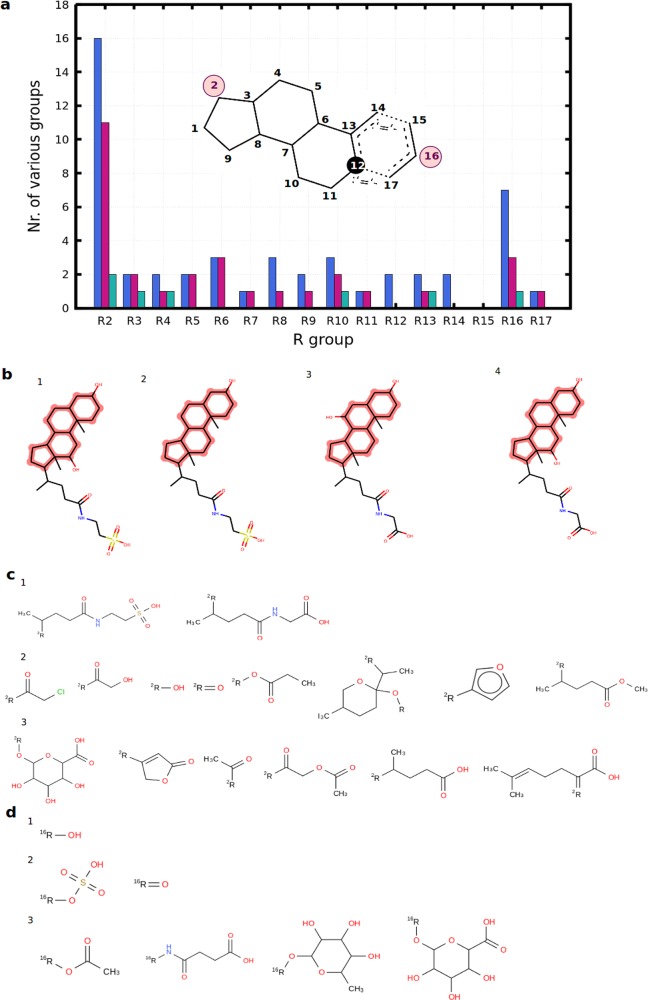
Figure 4.
R-group decomposition of steroidal inhibitors. (a) Stacked bar plot showing the distribution of the number of various functional groups at certain R-group positions (blue bar plots, OATP1B1 inhibitors; purple bar plots, OATP1B3 inhibitors; green bar plots, OATP2B1 inhibitors). The maximum common substructure of all of the steroidal inhibitors is shown to highlight the R-group positions. (b) Steroidal ligands with proven pan-inhibitory effect: (1) taurodeoxycholic acid; (2) lithocholyltaurine; (3) glycoursodeoxycholic acid; (4) glycodeoxycholic acid. (c) Functional groups identified at position 2 for (1) pan inhibitors, (2) dual OATP1B inhibitors, and (3) OATP1B1 inhibitors. (d) Functional groups identified at position 16 for (1) pan inhibitors, (2) dual OATP1B inhibitors, and (3) OATP1B1 inhibitors.

