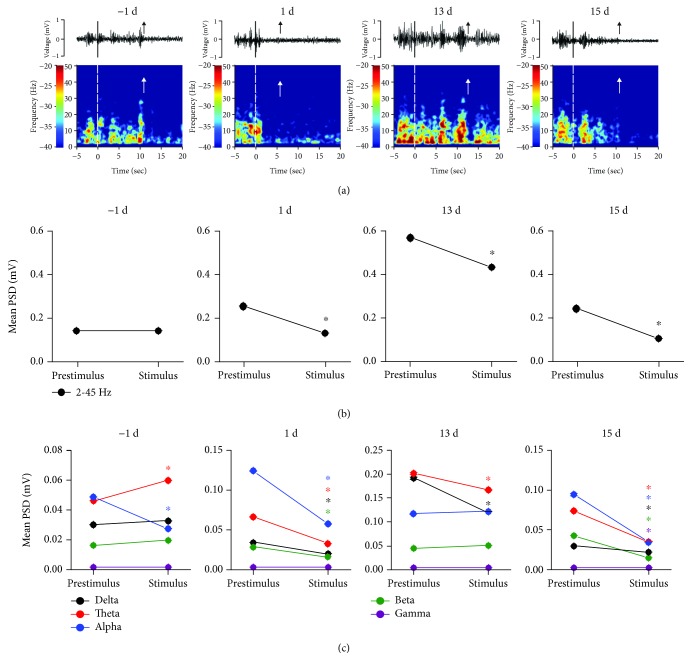
Figure 3.
Synchronous LFPs observed during nociceptive behavioral testing. (a) A spontaneous recording and real-time spectrogram for LFP signals of the prestimulus, stimulus, and poststimulus phases (black and white dashed lines indicate the start of the stimulus and the upward arrow represents paw withdrawal). (b) The change in the mean PSD observed within 2-45 Hz between the prestimulus and stimulus phases in the rACC. ∗p < 0.05 compared to the prestimulus phase. (c) The change in the mean PSD in different frequency bands between the prestimulus and stimulus phases in the rACC. ∗p < 0.05 compared to the prestimulus phase of the same band. Five frequency band intervals were considered: delta (2–4 Hz), theta (4–9 Hz), alpha (9–15 Hz), beta (15–30 Hz), and gamma (30–45 Hz).

