Figure 6.
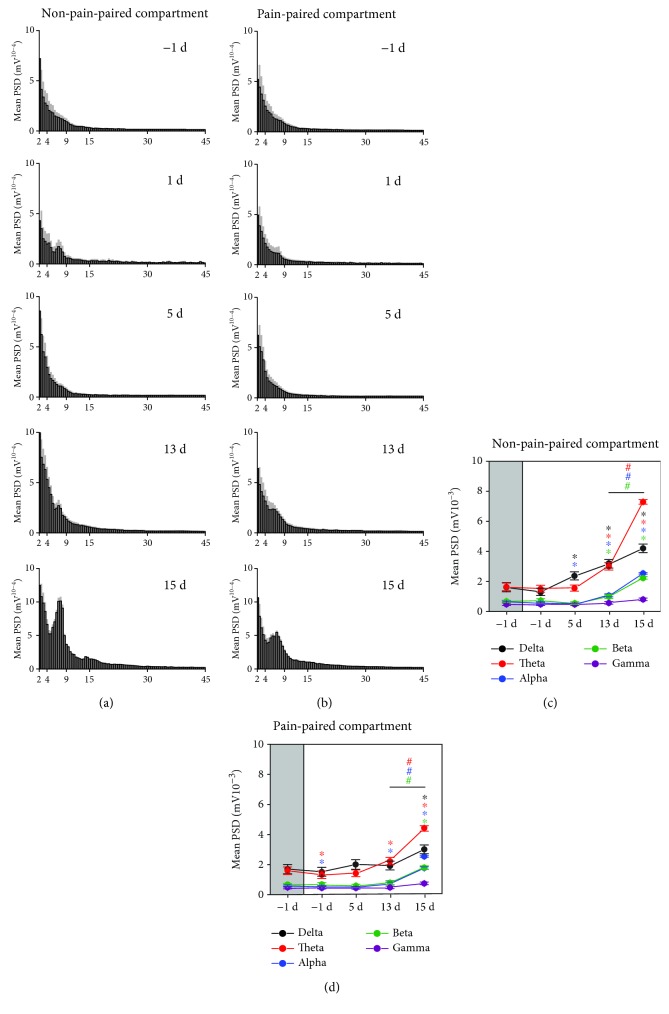
Synchronous LFPs during aversive behavioral testing. (a) Mean PSD histogram of the non-pain-paired compartment (the gray area indicates the standard deviation). (b) Mean PSD histogram of the pain-paired compartment (the gray area indicates the standard deviation). (c) Mean PSD of rACC LFPs for five frequency bands in the non-pain-paired compartment. ∗p < 0.05 compared to -1 d; #p < 0.05 compared to 13 d. (d) Mean PSD of rACC LFPs for five frequency bands in the pain-paired compartment. ∗p < 0.05 compared to -1 d; #p < 0.05 compared to 13 d. Five frequency band intervals were considered: delta (2–4 Hz), theta (4–9 Hz), alpha (9–15 Hz), beta (15–30 Hz), and gamma (30–45 Hz).

