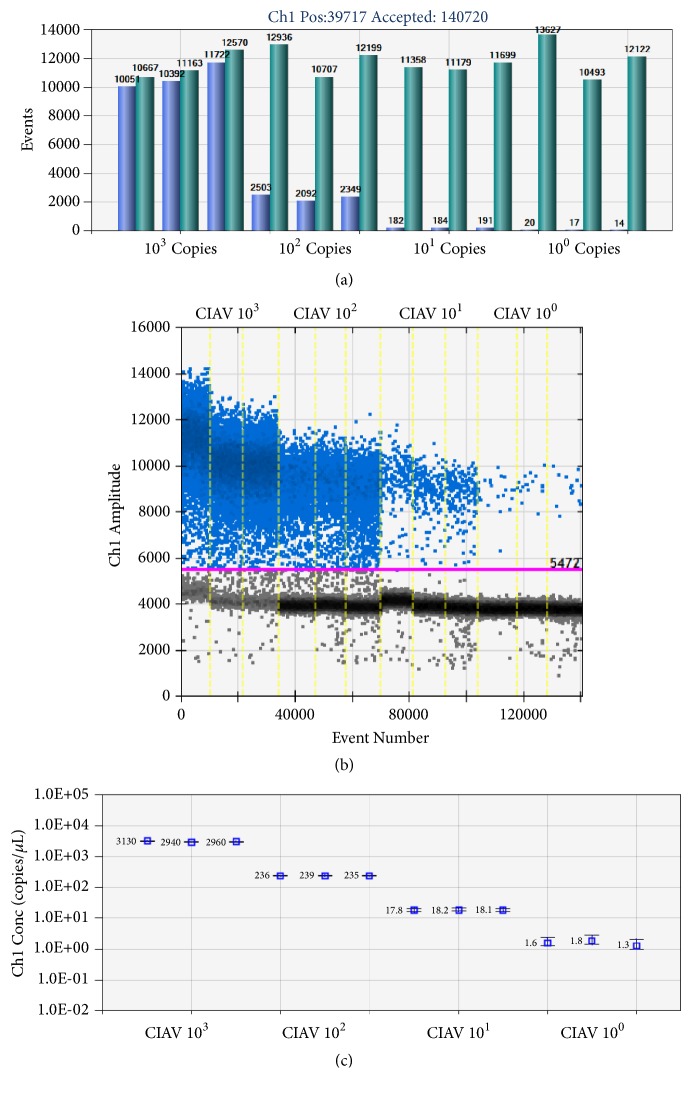
Figure 4.
dd-PCR with standard plasmid. (a) Positive and total droplets in tenfold serial dilution series of positive plasmid DNA. (b) Results of droplet amplification with different concentrations of the standard samples. (c) Linear regression of the ddPCR assay for the copy number of samples with different concentrations. The vertical axis shows the log 10 -transformed copy number/μL of the ddPCR reaction mixture. The horizontal axis indicates tenfold serial dilution series of positive plasmid DNA of the ddPCR reaction. The inner error bars indicate the Poisson 95% confidence interval (CI) and the outer error bars show the total 95% CI of replicates.

