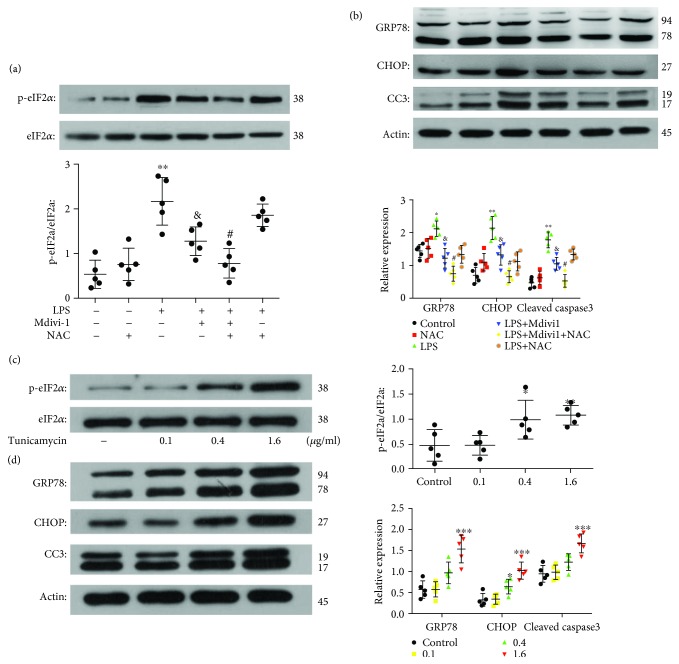
Figure 10.
NAC treatment further reduced the induction of ER stress after cotreatment with LPS and Mdivi-1. Moreover, ER stress was induced after tunicamycin treatment. (a, c) Western blot assay and quantitative analysis of p-eIF2α and eIF2α expression. (b, d) Western blot assay and quantitative analysis of GRP78, CHOP, and cleaved caspase-3 expression. The results are shown as the mean ± SD; n = 5. ∗ P < 0.05) vs. the control group (∗∗ P < 0.01,∗∗∗ P < 0.001); & P < 0.05 vs. the LPS group; # P < 0.05 vs. the LPS+Mdivi-1 group (P < 0.05). #Statistically significant difference compared with the LPS+Mdivi-1 group (P < 0.05)

