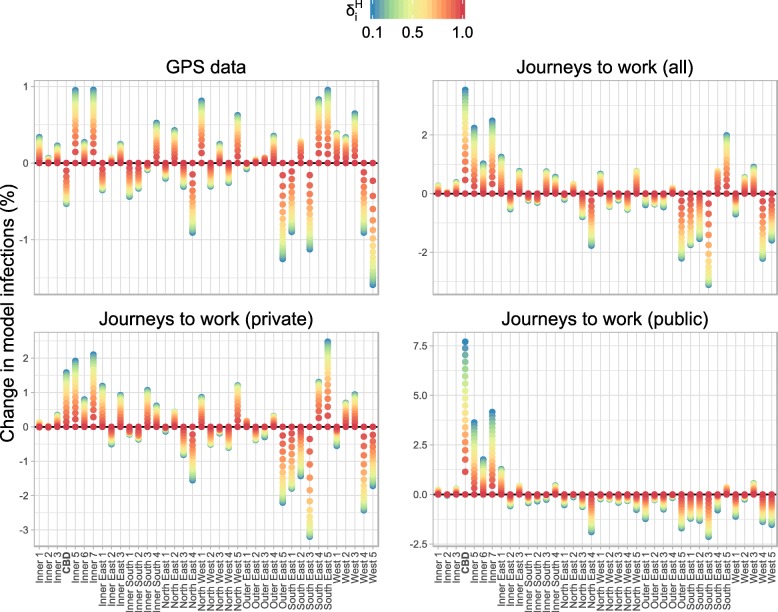
Fig. 3.
The change in model infections in each SA3 compared to the spatially-uniform model for δC=0.33, expressed as a percentage of the total number of infections across all SA3s. For the GPS data (top-left) when , an extra 1% of all infections occurred in the each of the Inner 5 (Port Phillip) and Inner 7 (Yarra) SA3s, and about 0.5% fewer of all infections occurred in the CBD. In contrast, for the private journeys to work data (bottom-left) when , an extra 1.5–2% of all infections occurred in each of those SA3s. And for the public journeys to work data (bottom-right) when , these same SA3s experienced an even greater proportion of all infections

