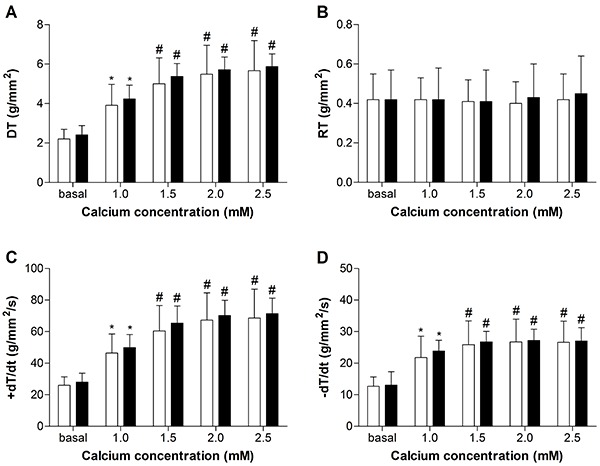
Figure 3. Effects of increased calcium concentration on myocardial function in papillary muscles from control (white bars; n=11) and obese (black bars; n=11) rats after 33 weeks. A, DT: maximum developed tension; B, RT: resting tension; C, +dT/dt: peak of positive tension derivatives; D, –dT/dt: peak of negative tension derivatives. Data are reported as means±SD. *P<0.05 vs basal; #P<0.05 vs basal and 1.0 mM calcium (ANOVA and Bonferroni).

