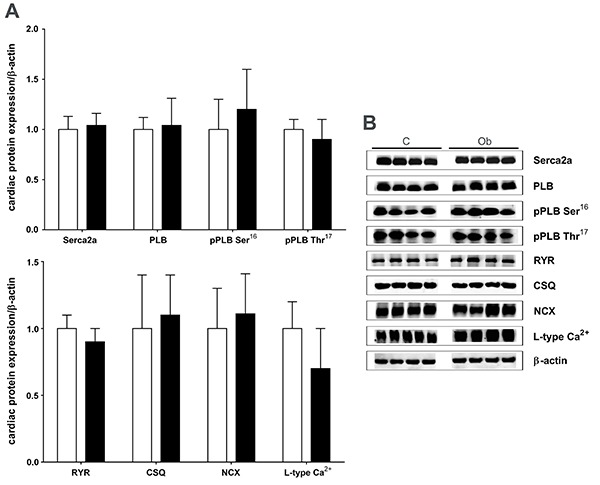
Figure 5. Western blot analysis of intracellular Ca2+-cycling proteins in myocardium from control (C, white bars) and obese (Ob, black bars) rats (n=6 in each group). A, Quantification of sarcoplasmic reticulum Ca2+-ATPase (SERCA2a), phospholamban (PLB), PLB serine-16 phosphorylation (pPLB Ser16), PLB threonine-17 phosphorylation (pPLB Thr17), ryanodine receptor (RYR), calsequestrin (CSQ), Na+/Ca2+ exchanger (NCX), and L-type Ca2+ channel. B, Representative bands of proteins evaluated by western blot. Data are reported as means±SD. Student's t-test for independent samples was used to compare data.

