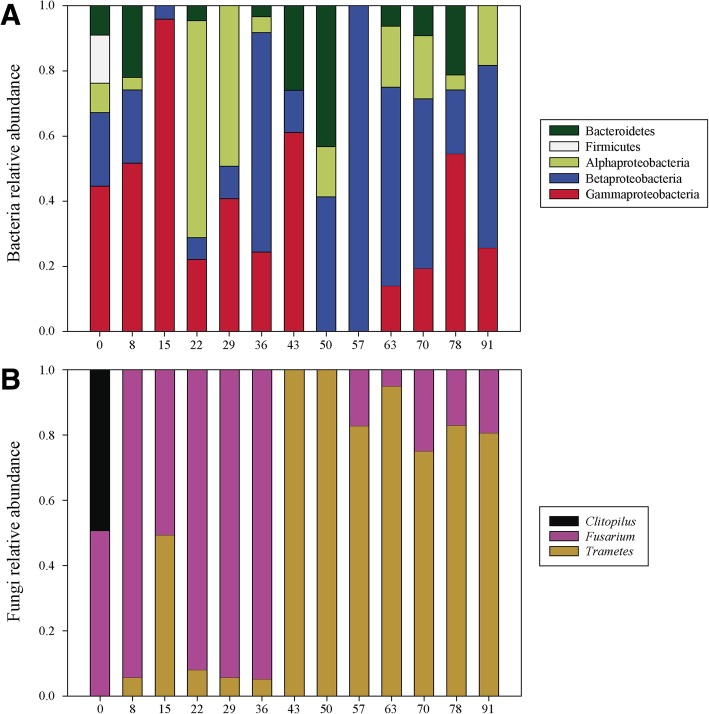
Fig. 5.
Phylogenetic assignment of bacterial (a) and fungal (b) sequences from the liquid matrix of the bioreactor. Data is presented in form of relative abundance, previously calculated using the semi-quantitative DGGE matrix and the sequenced bands from DGGE gels. Unidentified bands (10% for bacteria and 2% for fungi) were not represented

